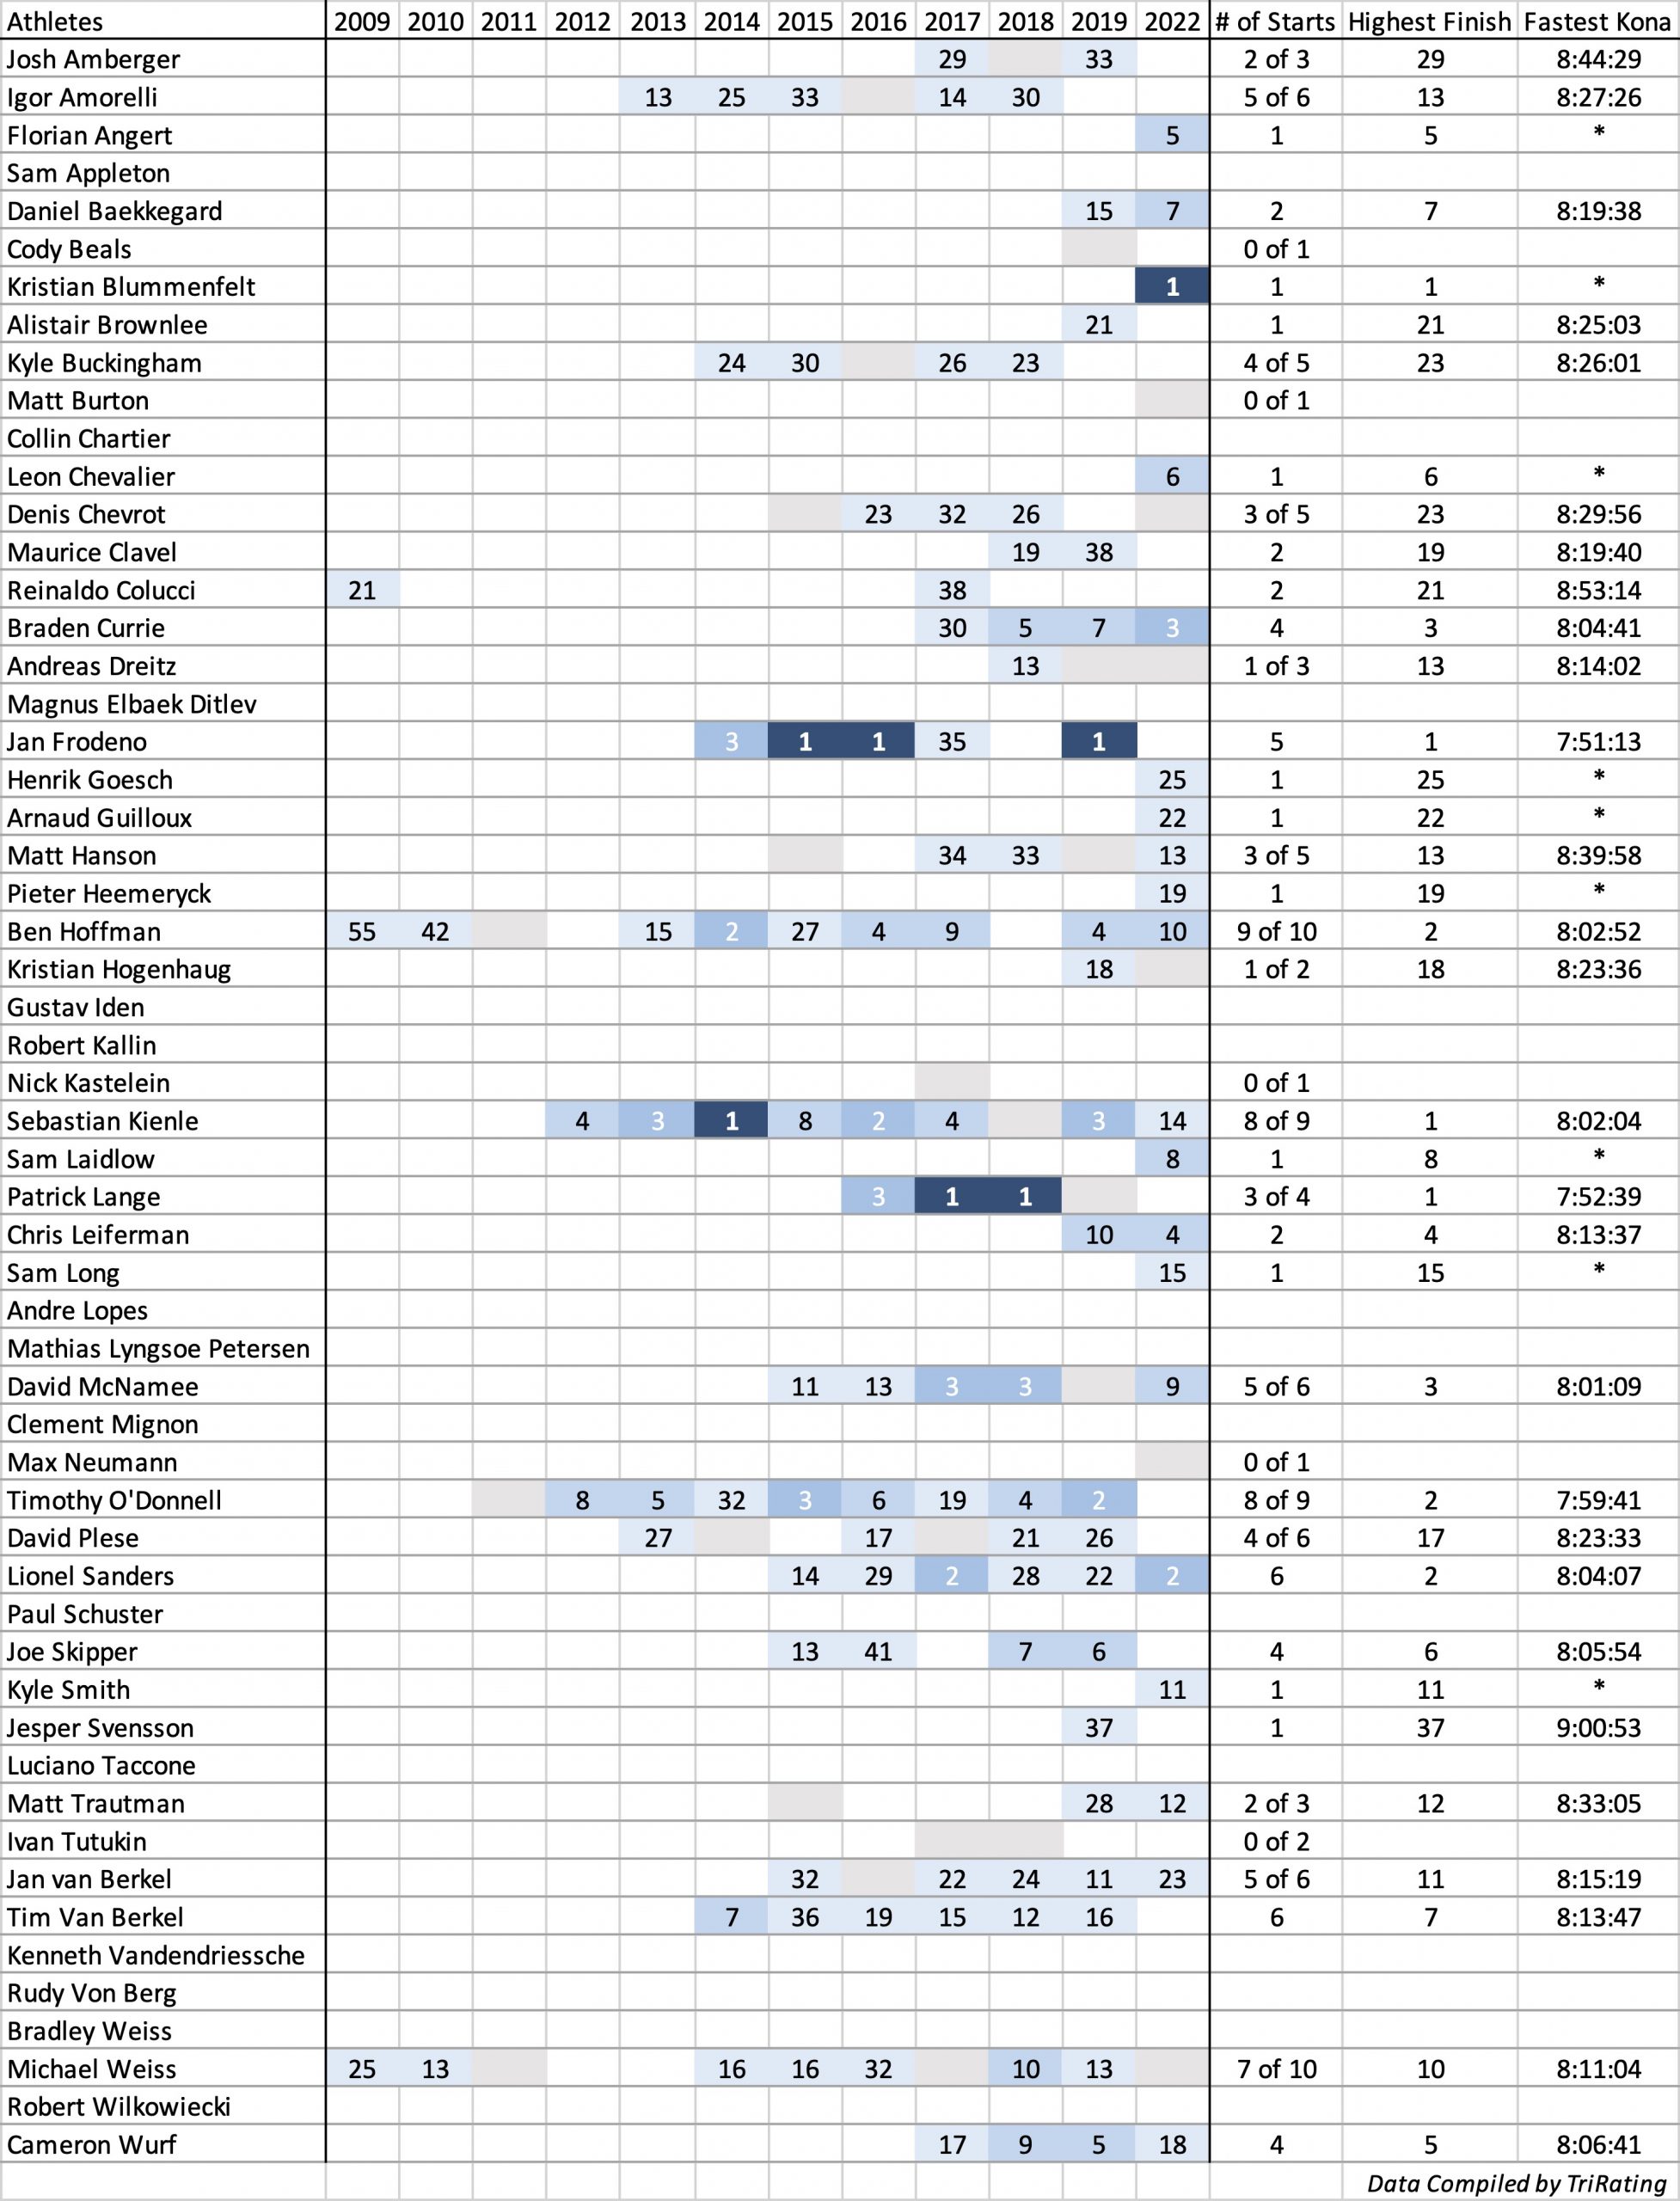
This post has a look at athletes who have raced at the Olympics and also in the Kona Pro field.
(Note: Some of my data for the earlier Kona Pro races might be incomplete, please let me know if I missed any athletes or additional Kona races for the athletes listed.)
Trivia
Here are a few highlights of the detailed data from the tables below:
- Jan Frodeno is the only athlete who was able to win the Olympics (Beijing 2008) and Kona (2015, 2016 & 2019). The most successful Olympics&Kona athlete on the women’s side is Michellie Jones (Silver Medal in Sydney 2000 and Kona winner 2006). Michellie and Jan are also the only athletes to podium in both events.
- Usually, athletes race Kona after the end of their Olympic-distance career – especially in recent years when success at either distance requires focussing on that distance. The biggest exception to this rule is Rob Barel from the Netherlands: He finished fourth in Kona 1984, a full 16 years before racing in Sydney 2000 as a 42-year-old.
- So far, only Joanna Zeiger has raced the Olympics and Kona in the same year. Joanna was fourth in August at the 2000 Olympic Games in Sydney, then went on to finish fifth in October in Kona.
- Joanna Zeiger, Sarah True and Andy Potts are the only US athletes who have raced the Olympics and the Kona Pro race. (You could add Greg Bennett to the list, he was racing for Australia in the Olympics 2004 and for the US in Kona 2012.) Sarah (fourth place in London 2012 and fourth in Kona 2018) slightly edges out Joanna to claim the best combined record among the US athletes.
Tokyo & Kona 2021
I have posted the startlists for the Olympic races (men July 26th, women July 27th) here. (In addition there is the Mixed Relay on July 31st.) Among the 112 athletes on the male and female lists, only Javier Gomez has raced in Kona before. He and Gustav Iden are qualified for Kona 2021, they could race the Olympics and Kona in the same year. Some others might try to qualify after the Olympics, there have been rumors of more Norwegians trying to make it to Kona this year.
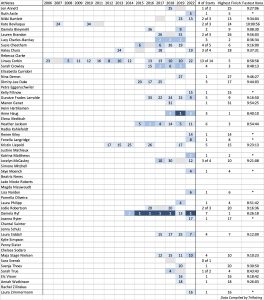
Women
| Athlete |
2000 |
2004 |
2008 |
2012 |
2016 |
Kona |
Best |
| Kate Allen (AUT) |
|
1 |
14 |
|
|
1 start (2002) |
7 |
| Jodie Cunnama (GBR) |
|
34 |
|
|
|
4 starts (2013-2016) |
4 |
| Ewa Dederko (POL) |
|
|
30 |
|
|
1 start (2005) |
DNF |
| Julie Dibens (GBR) |
|
30 |
|
|
|
2 starts (2010-2011) |
3 |
| Eva Dollinger (AUT) |
|
28 |
DNF |
|
|
1 start (2010) |
21 |
| Helle Frederiksen (DEN) |
|
|
|
27 |
|
1 start (2018) |
16 |
| Anne Haug (GER) |
|
|
|
11 |
36 |
2 starts (2018-2019) |
1 |
| Michellie Jones (AUS) |
2 |
|
|
|
|
4 starts (2005-2009) |
1 |
| Sibylle Matter (SUI) |
36 |
|
|
|
|
3 starts (2002-2008) |
9 |
| Samantha McGlone (CAN) |
|
27 |
|
|
|
3 starts (2007-2010) |
2 |
| Beatrice Mouthon (FRA) |
35 |
|
|
|
|
1 start (1995) |
8 |
| Isabelle Mouthon (FRA) |
7 |
|
|
|
|
1 start (1995) |
2 |
| Daniela Ryf (SUI) |
|
|
7 |
40 |
|
6 starts (2014-2019) |
1 |
| Jill Savege (CAN) |
|
39 |
|
|
|
1 start (2001) |
10 |
| Kathleen Smet (BEL) |
16 |
4 |
|
|
|
1 start (2005) |
14 |
| Sarah True (USA) |
|
|
|
4 |
DNF |
2 starts (2018-2019) |
4 |
| Samantha Warriner (NZL) |
|
18 |
16 |
|
|
1 start (2011) |
17 |
| Joanna Zeiger (USA) |
4 |
|
|
|
|
7 starts (1997-2007) |
5 |
| Lucie Zelenkova (CZE) |
|
DNF |
|
|
|
2 starts (2009-2011) |
22 |
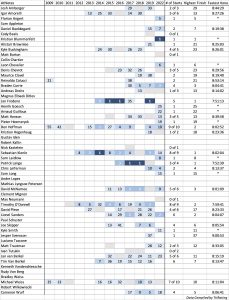
Men
| Athlete |
2000 |
2004 |
2008 |
2012 |
2016 |
Kona |
Best |
| Marko Albert (EST) |
|
21 |
41 |
|
|
6 starts (2011-2017) |
13 |
| Rob Barel (NED) |
43 |
|
|
|
|
3 starts (1984-1995) |
4 |
| Greg Bennett (AUS) |
|
4 |
|
|
|
1 start (2012) |
33 |
| Dirk Bockel (LUX) |
|
|
25 |
|
|
5 starts (2009-2013) |
4 |
| Alistair Brownlee (GBR) |
|
|
12 |
1 |
1 |
1 start (2019) |
21 |
| Tyler Butterfield (BMU) |
|
35 |
|
34 |
|
7 starts (2010-2018) |
5 |
| Will Clarke (GBR) |
|
|
14 |
|
|
3 starts (2016-2019) |
25 |
| Reinaldo Colucci (BRA) |
|
|
37 |
36 |
|
2 starts (2009-2017) |
21 |
| Bevan Docherty (NZL) |
|
2 |
3 |
12 |
|
2 starts (2013-2014) |
DNF |
| Norbert Domnik (AUT) |
|
37 |
|
|
|
2 starts (2007-2008) |
51 |
| Tim Don (GBR) |
10 |
18 |
|
|
|
3 starts (2015-2018) |
15 |
| Daniel Fontana (ITA) |
|
28 |
33 |
|
|
6 starts (2010-2019) |
12 |
| Jan Frodeno (GER) |
|
|
1 |
6 |
|
5 starts (2014-2019) |
1 |
| Oscar Galindez (ARG) |
28 |
|
|
|
|
2 starts (2005-2006) |
11 |
| Javier Gomez (ESP) |
|
|
4 |
2 |
|
1 start (2018) |
11 |
| Rasmus Henning (DEN) |
|
7 |
8 |
|
|
4 starts (2009-2012) |
5 |
| Marek Jaskolka (POL) |
|
|
|
47 |
|
1 start (2014) |
22 |
| Andrew Johns (GBR) |
DNF |
16 |
|
|
|
1 start (2006) |
27 |
| Brad Kahlefeldt (AUS) |
|
|
16 |
31 |
|
1 start (2015) |
DNF |
| Simon Lessing (GBR) |
9 |
|
|
|
|
1 start (2005) |
DNF |
| Eneko Llanos (ESP) |
23 |
20 |
|
|
|
13 starts (2006-2019) |
2 |
| Brent McMahon (CAN) |
|
39 |
|
27 |
|
4 starts (2015-2018) |
9 |
| Hiroyuki Nishiuchi (JPN) |
46 |
32 |
|
|
|
5 starts (2005-2011) |
34 |
| Takumi Obara (JPN) |
21 |
|
|
|
|
1 start (2006) |
49 |
| Filip Ospaly (CZE) |
DNF |
29 |
20 |
|
|
1 start (2014) |
31 |
| Andy Potts (USA) |
|
22 |
|
|
|
11 starts (2008-2019) |
4 |
| Andreas Raelert (GER) |
12 |
6 |
|
|
|
8 starts (2009-2016) |
2 |
| Ivan Rana (ESP) |
5 |
23 |
5 |
|
|
6 starts (2013-2018) |
6 |
| Daniil Sapunov (UKR) |
|
17 |
21 |
42 |
|
1 start (2019) |
24 |
| Hirokatsu Tayama (JPN) |
|
13 |
48 |
20 |
DNF |
1 start (2005) |
29 |
| Stephan Vuckovic (GER) |
2 |
|
|
|
|
6 starts (2005-2010) |
10 |
| Ruedi Wild (SUI) |
|
|
|
39 |
|
3 starts (2016-2018) |
14 |
| Axel Zeebroek (BEL) |
|
|
13 |
|
|
4 starts (2011-2014) |
15 |

 Updates: