Every year there are announcements that record numbers of women are participating in Ironman races. This post checks the numbers behind these claims and offers some more data on female participation.
Number of Female Finishers
The last years before the Ironman World Championships in October, a number of press releases and posts claimed record numbers of female participants in Kona such as an Ironman press release from 2015 (“It will be the largest female field in the event’s history”) or a post by Triathlete magazine from 2016 (“That marks the largest female field ever at the Ironman World Championship”).
So here’s a look at the number of Female Finishers in Kona:

There has been a steady climb in the last years from about 500 in 2008/09 to 697 in 2016. This growth in absolute numbers is not limited to Kona, here’s a graph showing the total number of female finishers in all Ironman races:

For all Ironman races the growth is even more pronounced, female finisher numbers were pretty steady at about 7.000 between 2007 and 2009, the number of females in Ironman has more than doubled to almost 16.000 for the 2016 season.
Percentage of Female Finishers
While it’s great to see more and more women finish in Kona or an Ironman in general, absolute numbers are not indicative of women playing a bigger role in Ironman racing. For Kona, the number of females racing is mainly a result of the qualifying system (I’m sure there are a lot more men and women who’d love to race there), and for all Ironman races you can evaluate the growth of female finishers only in conjunction with the increased number of Ironman races per season. So here are graphs showing the percentage of females among the overall number of finishers, both for Kona and for all Ironman races:


These graphs paint a less positive picture: While the share of females has been increasing in the last few years, that growth is relatively small: For Kona it has grown from about 27.5% between 2008 and 2011 to 30.2% this year, and the overall growth has been even smaller (from about 18% to 20% this year). Obviously, there is still a lot to accomplish before even close to 50% of Ironman finishers are females.
Regional Differences
In analyzing the data, I have noticed that there a lot of differences between races. The following graph shows the percentage of female finishers by continent, distinguishing between the North American, the European and “rest of the world” races:

Clearly, North America has the biggest share of female racers, while Europe has the smallest.
Breaking this down into individual races shows that there is surprisingly little “overlap” between these three groups, for example even the European race with the biggest percentage (IM Sweden with 14.7% of female finishers) has a lower share than all North American races, even the one with the lowest percentage (IM Louisville with 21.4%):

Outlook
The data shows large regional differences, and there are probably lots of others differences buried in the data (maybe between age groups or finishing times?). I haven’t found any detailed analysis of finisher data such as the graphs above (please let me know if they are out there), and I’d be interested in further analysis.
Also, I am not aware of a “good explanation” for these differences, but I hope that a discussion can lead to hints at how to further increase female participation in the future for existing races – and for new races as well. I hope this post helps in advancing the discussion.
Thank you to Russell Cox for supplying the data underlying the analysis and the graphs.
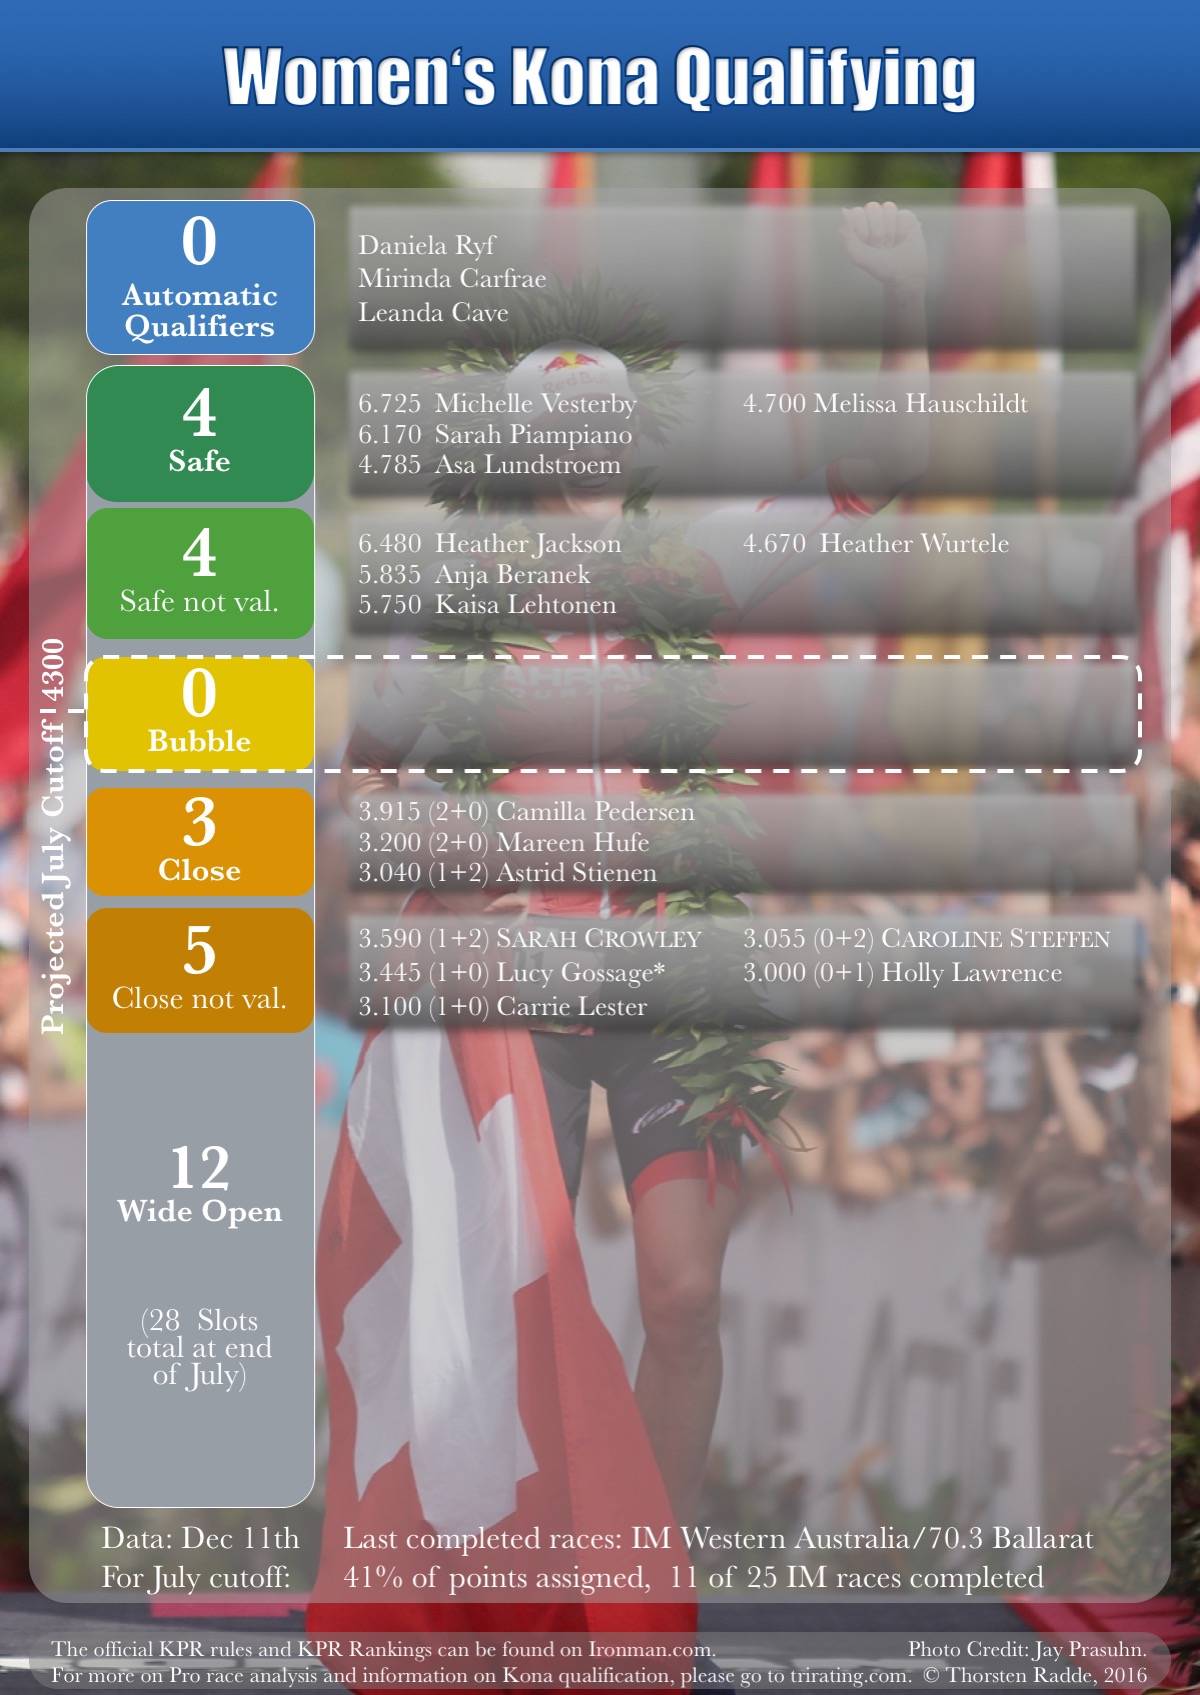
 I have just released the 2017 edition of the KPR Observer, following Kona qualifying for the Professional athletes.