Skip to content

December 2015

2016 Kona Pro Qualifying in Five Charts

While 2016 Kona Pro Qualifying takes a bit of a breather after the fall races, I wanted to discuss a few charts and observations about this qualifying cycle. The KPR rules itself haven’t changed, but there are some subtle issues that will impact how the season develops.

Ironman Races Qualifying for Kona 2016

Here is an overview of the Ironman races that offer qualifying points for the first cutoff at the end of July for Kona 2016. To be exact, the first of these races was IM Vichy on August 30th, the last ones will be IM Switzerland, IM Lake Placid (WPRO only) and IM Whistler (MPRO only) on July 24th.

The following table shows for each of the continents and months when IM races with a Pro category will be (the numbers correspond to the day of the race):

IMRaces

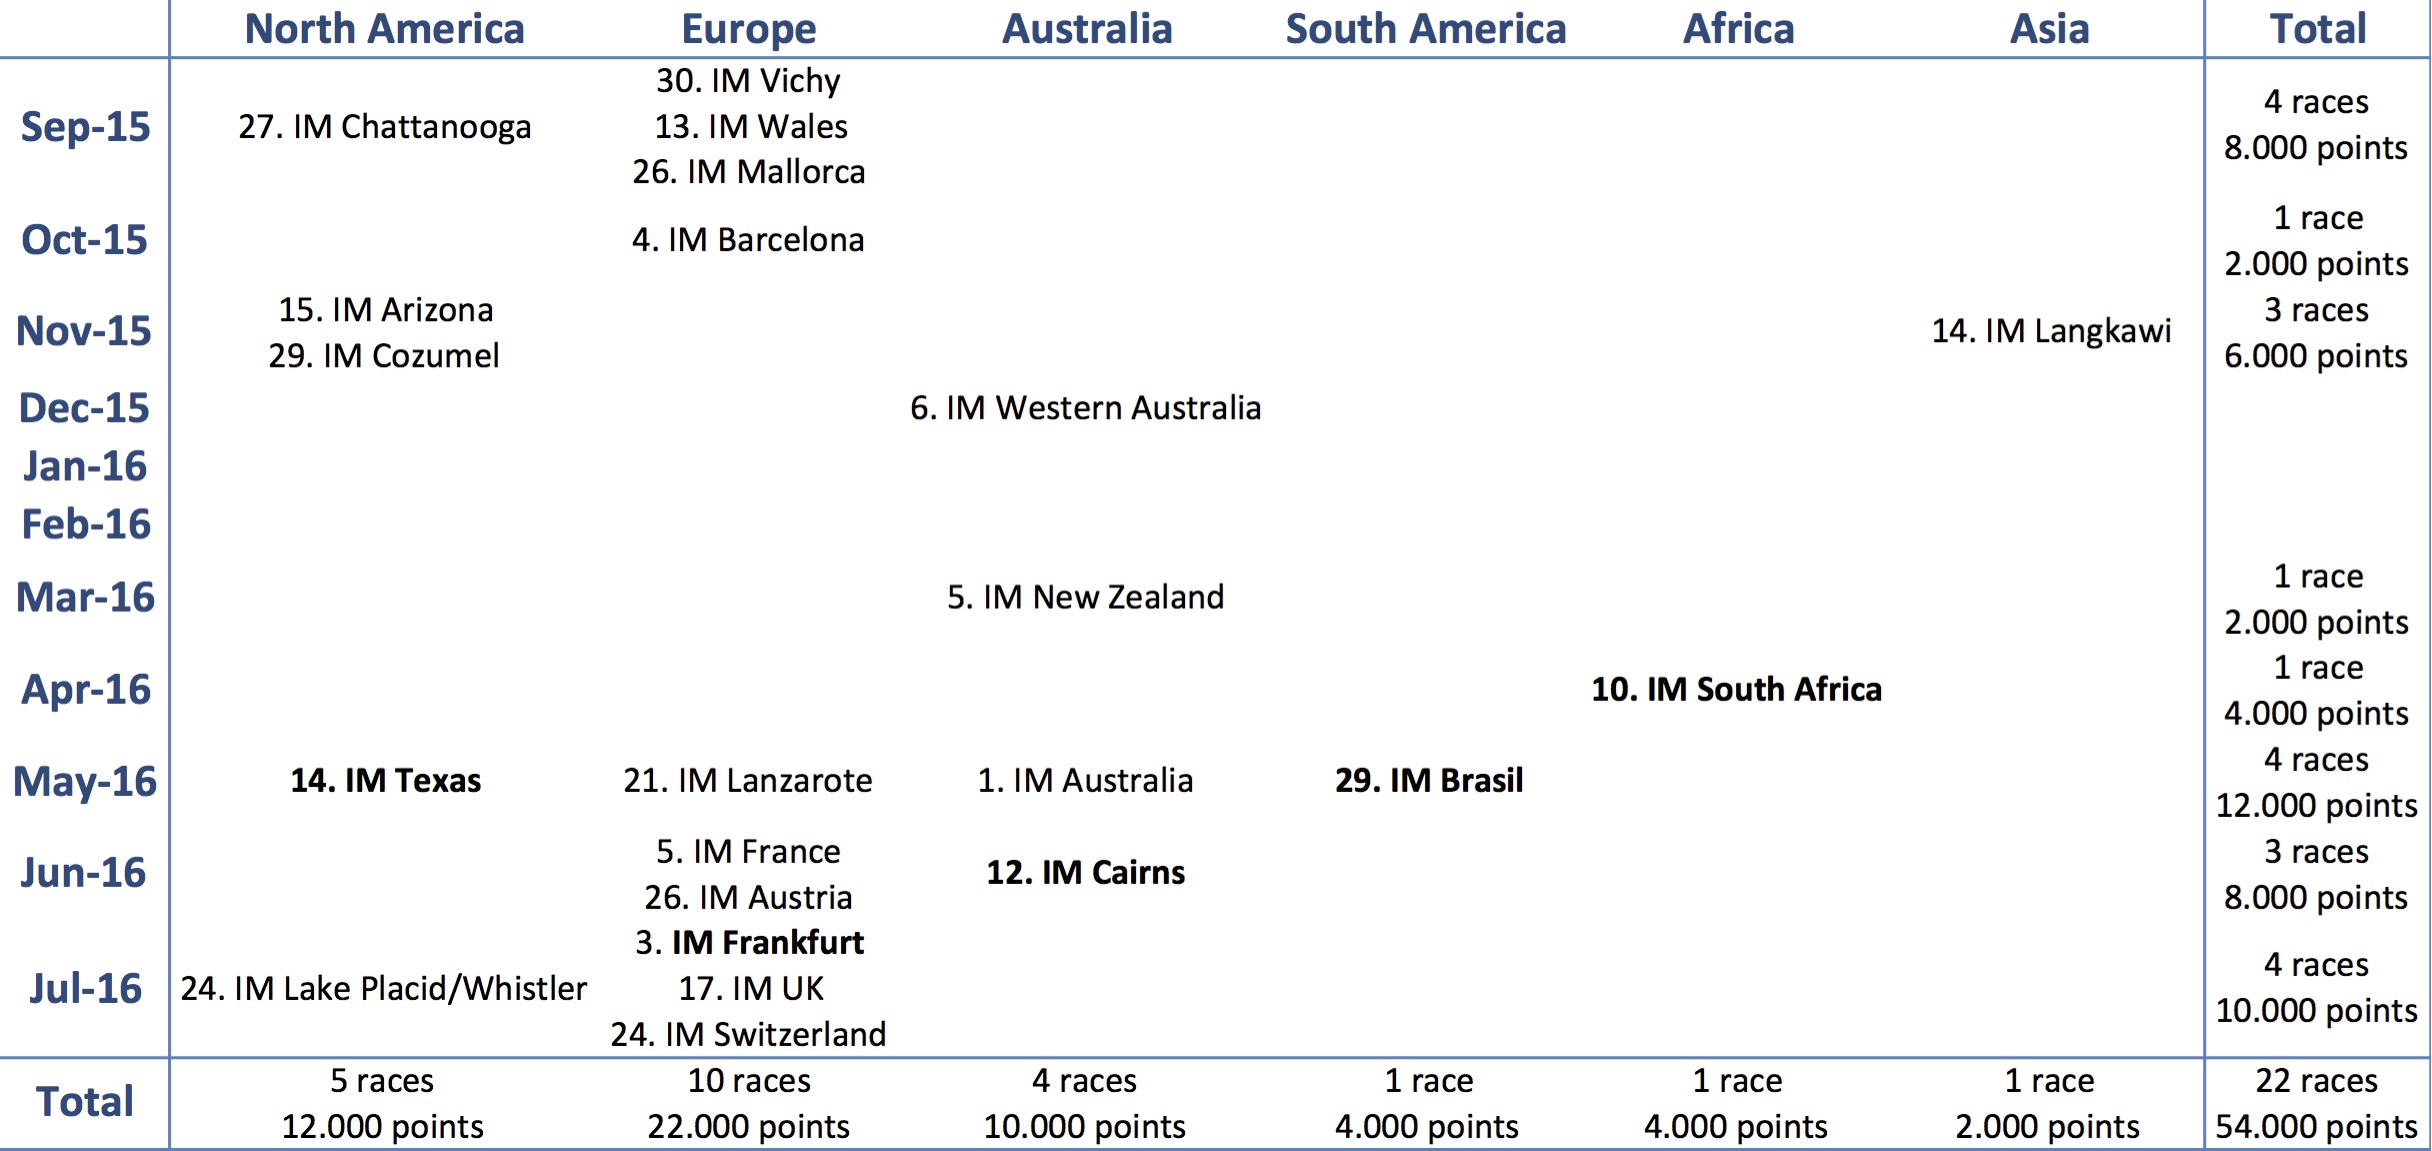
The only Ironman not shown here is IM Hawaii, which is an 8000 points race in October, but as a World Championship it doesn’t really “belong” to one continent. In addition, there will be some more Ironman races in August, but these haven’t been finalized yet and are not included in any further graphs.

KPR Points in IMs Per Continent From 2014 to 2016

The following chart shows how the total number of KPR points per continent has changed over the last few years (again excluding the August races but showing “Kona” as a separate category):

KPRYears

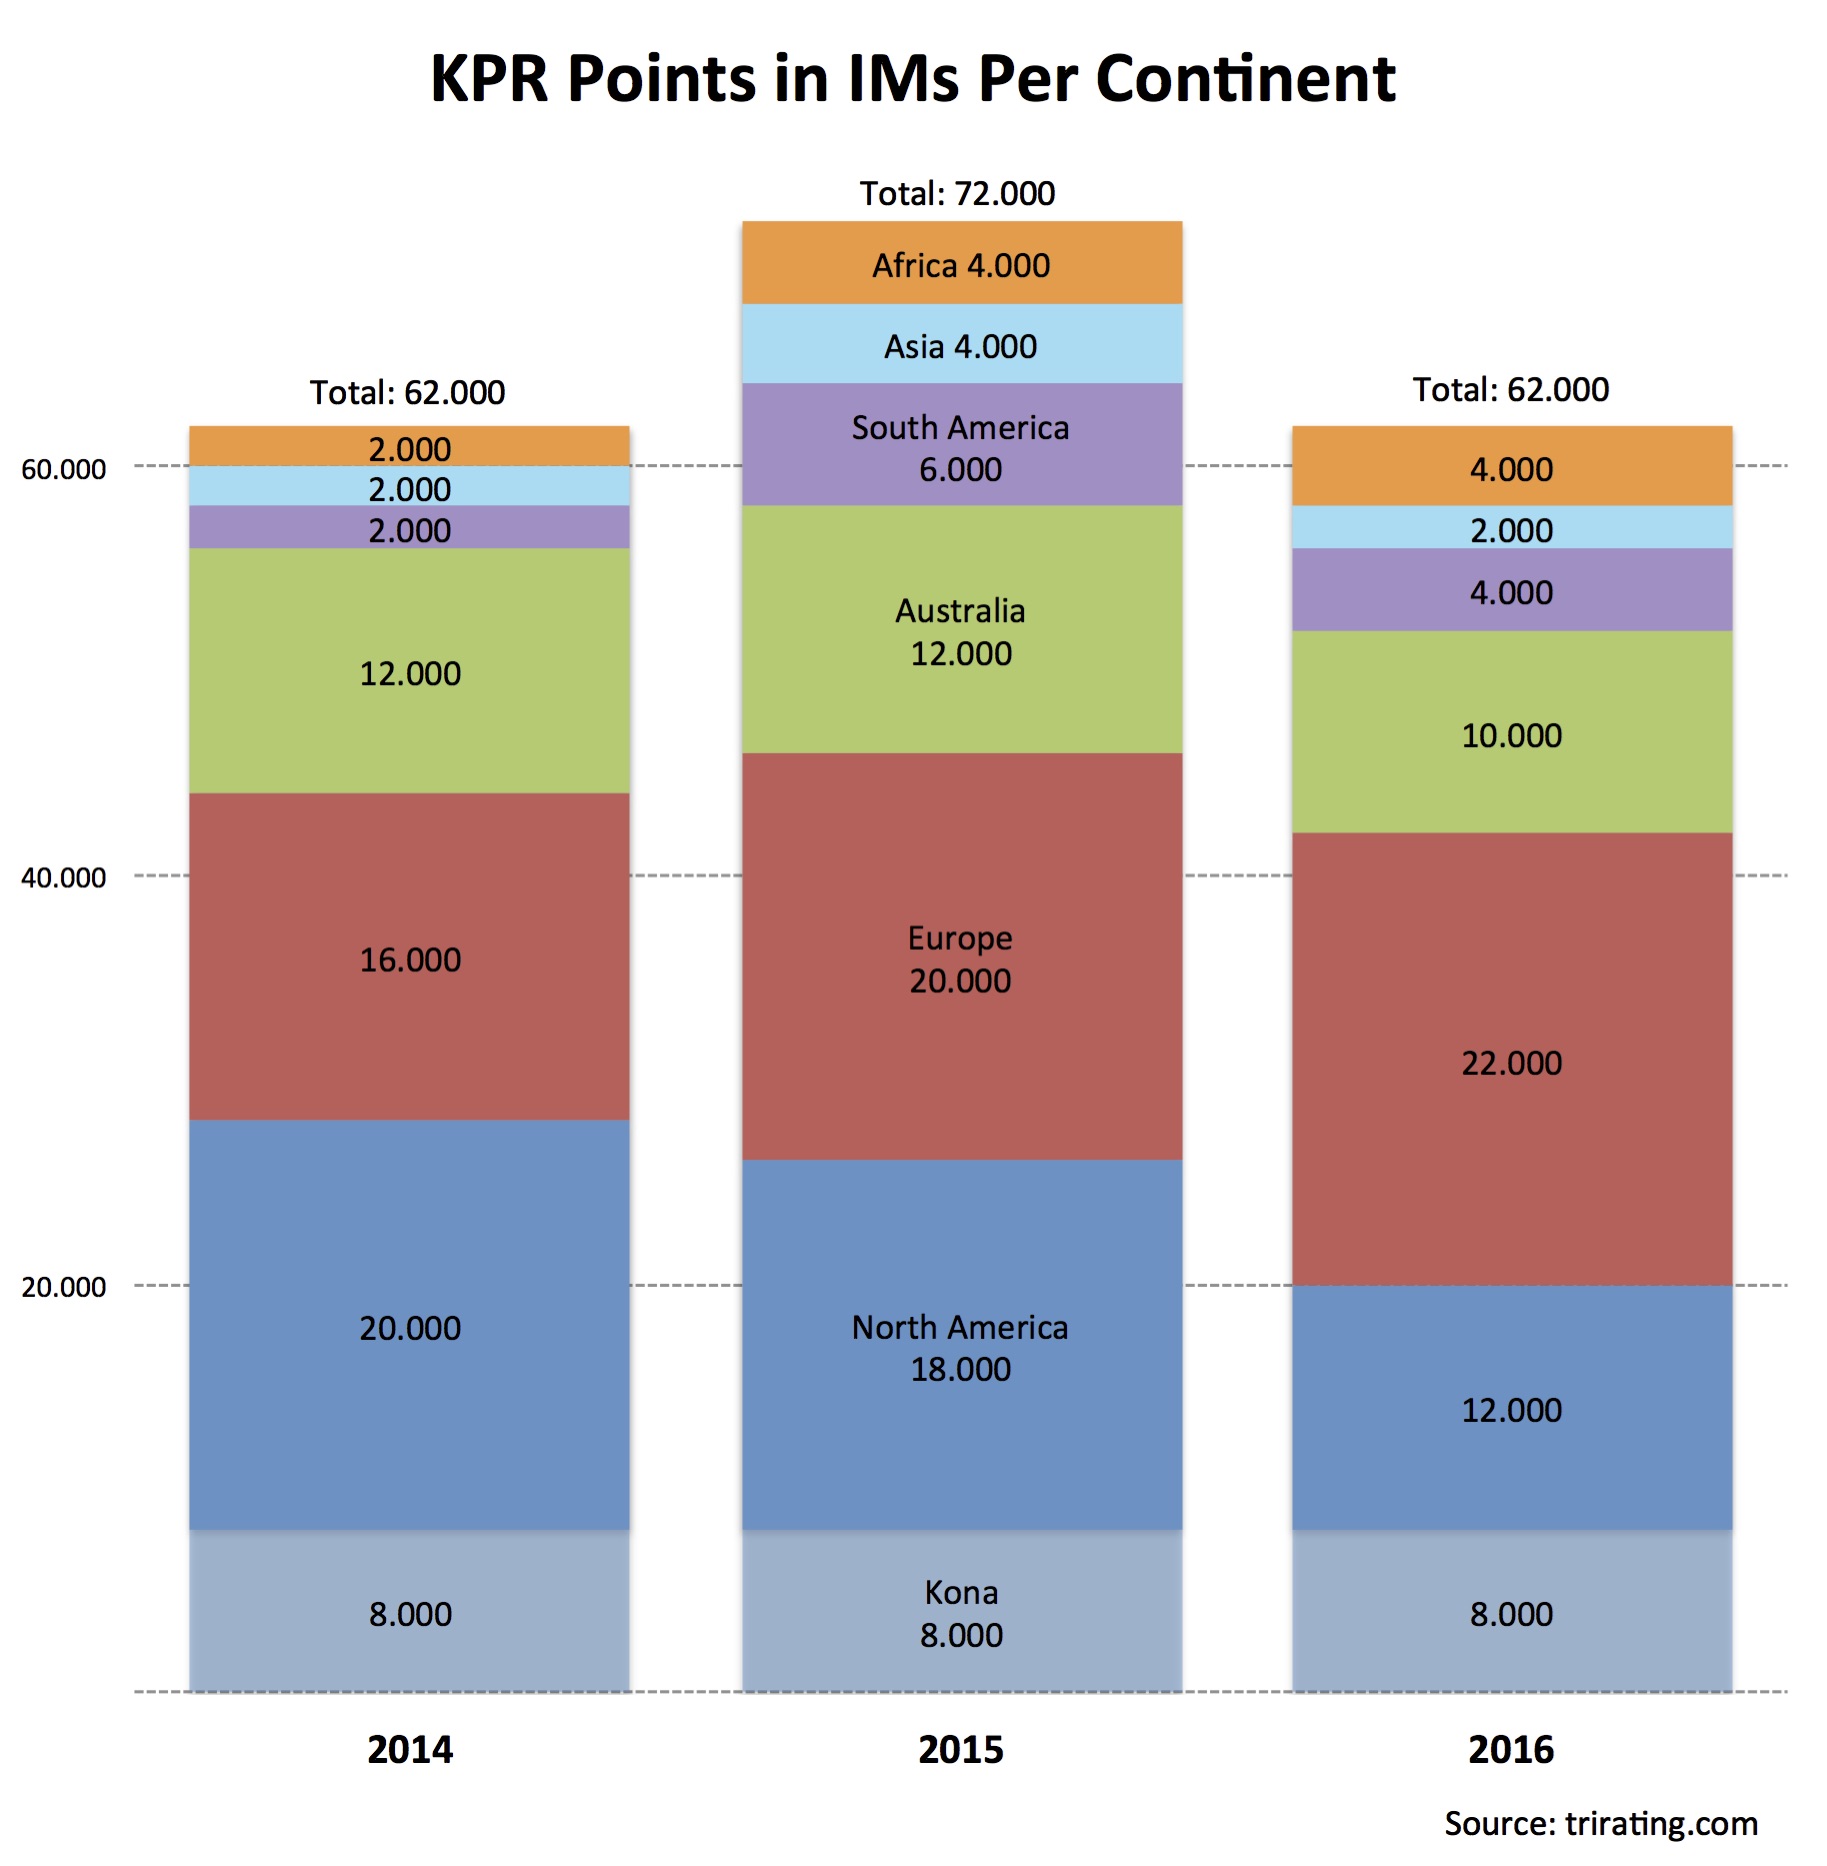
Some observations about the developments:

  • The number of North American IMs has been shrinking (Wisconsin and Florida no longer a Pro race in 2016, and Coeur d’Alene moves to August probably without a Pro category).
  • Growth in Europe continues (IM Vichy as an additional race in the 2016 season), overtaking North America as the continent with the most IM races and KPR points.
  • There have been declines in Asia (IM Taiwan moving to October, Pro category not clear; also cancellation of IM Japan in August), Australia (cancellation of IM Melbourne) and South America (Fortaleza without a Pro race in 2016 season)

Some of these changes are short term changes that will probably be reversed in the following years, for example Ironman has expressed their interest in expanding in the Asian market. But I expect the trend of fewer Pro races to continue, and probably be extended from North America to other continents. The way I see it, this is a likely change for the expected 2017 redesign of the KPR.

Breakdown Of 2016 Points By Continent

The reduced number of IM Pro races has been most pronounced in North America. The following chart shows the distribution of the 2016 KPR points (excluding Kona) available in the different continents:

KPRPoints

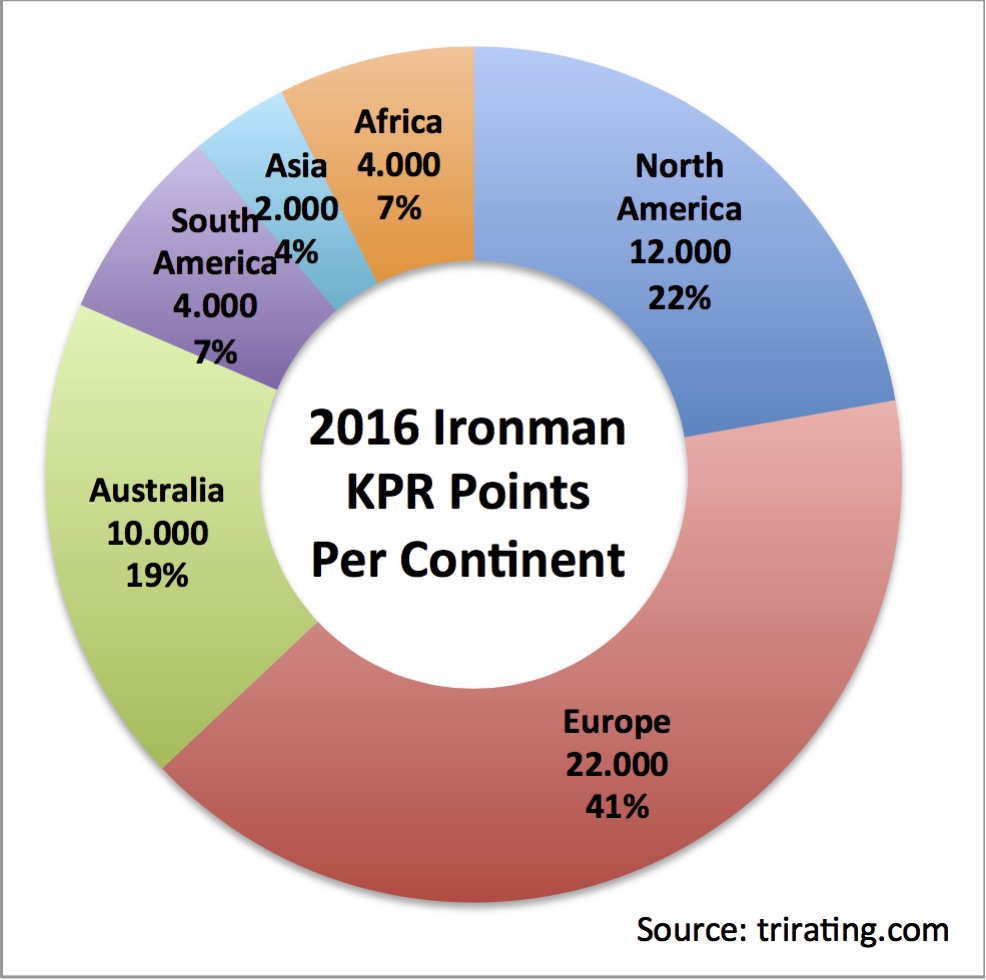
This corresponds quite well to the number of races: Europe has 10 of 22 non-Kona races (45%), while North America only has 5 (23%).

Breakdown Of 2016 Prize Money By Continent

There is less of a disadvantage for North America when considering the Prize Purse:

KPRPrizePurse

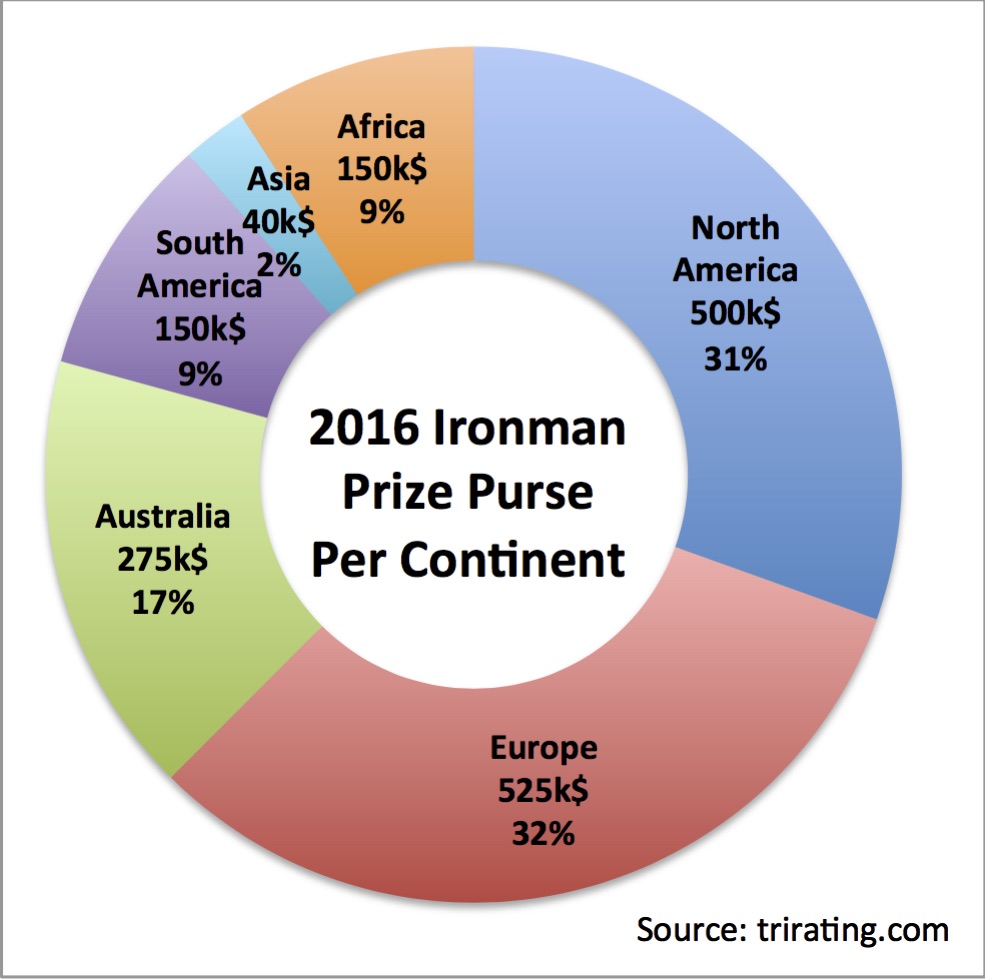
Most of the North American IMs are races with a 100k$ prize purse, while a lot of the European races only offer 25k$ for the field.

Breakdown of 2015 Pro Finishers Per Continent

To build an opinion if Ironman’s distribution of races is detrimental to North American Pros, one has to consider where the Pros are from. The next chart breaks down the number of Ironman finishers in 2015 season Pro races based on athlete’s nationality and corresponding continent:

ProFinishers

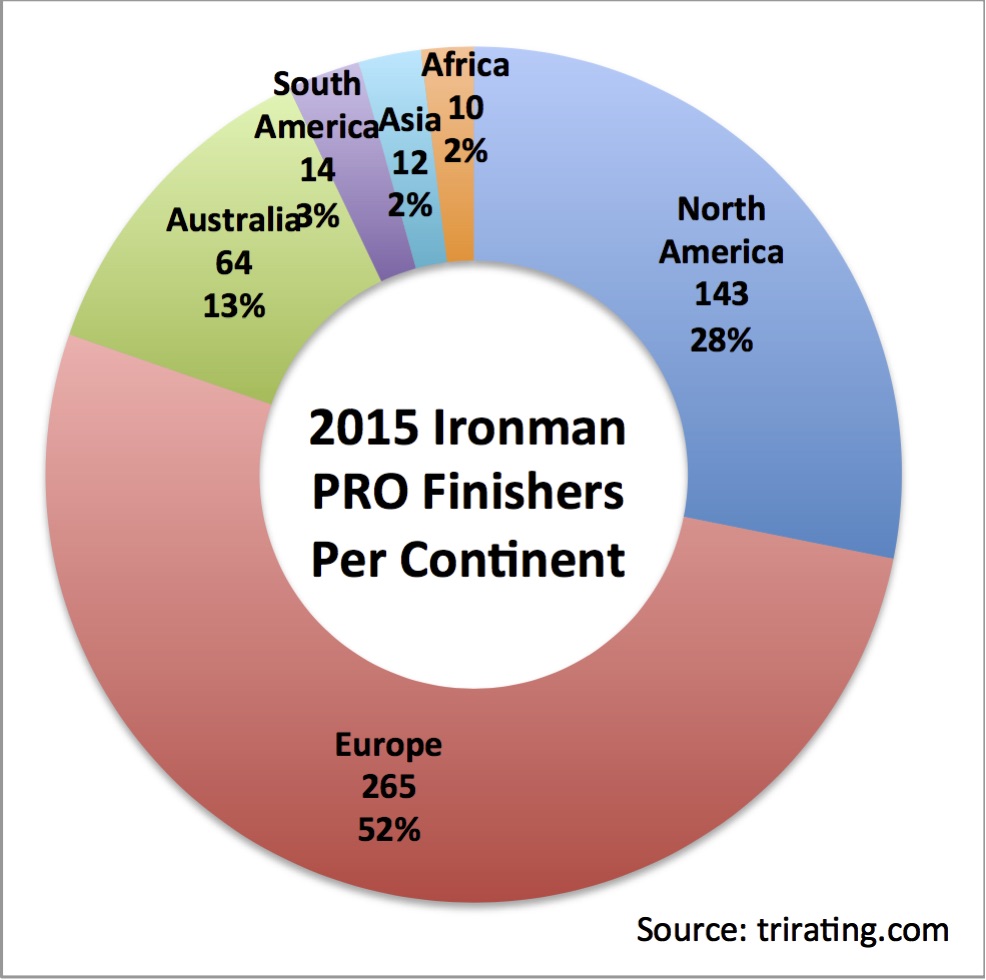
(I could have included a similar chart showing the number of Pros qualified for Kona per continent, but the distribution is almost identical and wouldn’t have provided additional information.)

Comparing the points distribution to the distribution of the athletes:

  • Europe has the most Pros and also the largest number of points. Still there are only 41% of the points for 52% of the Pros.
  • There is also a gap for North America, but the difference is smaller (22% of points for 28% of the Pros).
  • Australia has more points than their share of Pros would indicate (19% of the points vs. 13% of the Pros).
  • The continents with fewer Pros have a larger share of points, especially South America and Africa who only have between 1% and 3% of the Pros but 4% to 7% of the points.

Summary

Comparing the continents based on the nationality of athletes may not be completely fair to North America, as there are a lot of non-US athletes that have moved to the US or at least spend a considerable time there. But the number of IMs in North America is still roughly fitting as North America has a larger share of the prize money and also a larger number of 70.3s (in the 2015 season, there have been 17 in Europe and 25 in North America) which should help both the established Pros and the athletes still growing in the Pro ranks. However, qualifying for Kona as a Pro is more and more a year-round and global endeavor, one that needs careful planning and almost flawless execution.

If you are interested in Pro qualifying, you should subscribe to the 2016 KPR Observer newsletter!
More details can be found here.

Ironman Western Australia 2015 – Analyzing Results

Race Conditions

Even with the smaller field this year, the athletes in the Busselton race posted fast times, mainly aided by the flat bike course. This year’s adjustment of 14:52 is almost the same as the course’s new rating of 13:15. Compared to last year, the windy conditions lead to the swim and bike being a little bit slower, but allowed for a quicker run.

Male Race Results

LukeWA

Luke McKenzie had a fantastic day of racing: It only took him 20 miles to erase his two minute deficit after the swim, and he never waited for anyone to set the pace on the bike for him. Before the race he had said he couldn’t see “a 4:15 bike split happen” – instead he annihilated the 4:18 bike course record by Mitch Anderson with a fantastic 4:08 bike leg (the second fastest in 2015)! He followed that up with a 2:52 marathon which was within a minute of his IM marathon PR (a 2:51:37 from Louisville 2009). Combined, this gave him a new Ironman PR, also improving the old course record (8:03:55 by Jason Shortis from 2006). In addition, this is now the fastest time on Australian soil, beating the old record of 7:57:44 by Craig Alexander from Melbourne 2012. The Australian Iron-distance record is still held by Chris McCormack (7:54:23 from Roth 2007).

It took more than 20 minutes after Luke for the next athlete to cross the finish line: Defending champion Denis Chevrot had a good race but with Luke’s fantastic day it was clear he was only in a race for second place. There was a close race for third place, Per Bittner managed to hold off David Dellow who had the best marathon of the day.

Jens-Petersen Bach in fifth had a good comeback race after a string of injuries, while Christian Kramer had to pay the price with a 3:07 marathon for trying to limit the distance to Luke on the bike.

Rank Name Nation Swim Bike Run Time Diff to expected Prize Money
1 Luke McKenzie AUS 00:50:31 04:08:12 02:52:29 07:55:58 -28:22 US$ 10000
2 Denis Chevrot FRA 00:48:45 04:28:58 02:54:49 08:16:24 -09:11 US$ 5000
3 Per Bittner GER 00:50:56 04:27:33 02:56:37 08:19:15 -08:08 US$ 3250
4 David Dellow AUS 00:50:36 04:38:22 02:46:04 08:19:24 08:43 US$ 2500
5 Jens Petersen-Bach DEN 00:51:53 04:37:00 02:51:47 08:25:04 01:38 US$ 1750
6 Christian Kramer GER 00:49:42 04:26:49 03:07:52 08:28:33 03:14 US$ 1250
7 Adam Gordon AUS 00:57:28 04:49:29 02:52:39 08:44:35 -42:54 US$ 750
8 Petr Vabrousek CZE 01:02:23 04:42:10 03:06:03 08:55:19 09:22 US$ 500
9 Darren Jenkins AUS 01:07:55 04:48:29 02:58:10 08:59:50 01:34
10 Jarmo Hast FIN 00:52:18 04:47:45 03:24:13 09:09:43 37:07
Tim Reed AUS 00:50:54 04:28:48 DNF
Fredrik Croneborg SWE 00:51:56 04:36:44 DNF
Todd Skipworth AUS 00:48:41 04:40:23 DNF
Bryan Rhodes NZL 00:50:33 04:39:41 DNF
Courtney Ogden AUS 00:52:03 04:38:19 DNF
Allister Caird AUS 01:02:38 04:30:08 DNF
Simon Billeau FRA 00:57:33 DNF

Female Race Results

A small, but fast field of women made the female race very interesting. In her IM debut race, Georgie Rutherford led the race into T2 but she struggled with her nutrition for the rest of the day. Yvonne Van Vlerken took control of the race on the bike and quickly built a lead over Dimity-Lee Duke who swam a few seconds faster. But it quickly became apparent that the real threat for Yvonne would come from the pair of Mareen Hufe and Sarah Piampiano who had lost four minutes to Yvonne in the swim but were keeping the difference under control. Towards the end of the bike Mareen was eating a bit into Yvonne’s lead, and she was second in T2 about three minutes back putting about three minutes into Sarah. It was quickly apparent that Sarah would have the best run of the three leaders, and when Yvonne had to walk a bit after vomiting, Sarah took the lead and managed to build a solid lead. What a fantastic year for Sarah: A year ago she raced Busselton as her comeback Ironman race after being forced to take some time off with a broken leg, now she can look back to a great season of racing including qualifying for Kona, finishing seventh there and winning her first Ironman title! (She’ll still have some goals left for 2016: Sub-9 finish, a sub-3 marathon and I’m sure she’d love to be on the Kona podium – qualifying has already been taken care of.)

SarahWA

Behind Sarah, Yvonne continued to struggle with food poisoning and Mareen managed to have a good run until the finish. (In Kona she was in the Top 10 less than 5k from the finish but then had to walk for most of the rest.) After crashing at Mandurah 70.3 and struggling for a while with her injuries, Mareen finished in second place and scored valuable KPR points to keep Kona qualifying in reach. Yvonne’s 9:12 finish would have been good enough to win a number of Ironman races, in Busselton it resulted in a third place. She’ll only need a few more points to secure a Kona slot (placing well in a 70.3 should be enough for her). But first it’s time to take a break to recover from a lot of hard racing in 2015!

Rank Name Nation Swim Bike Run Time Diff to expected Prize Money
1 Sarah Piampiano USA 01:06:49 04:50:46 03:01:18 09:03:47 -15:32 US$ 10000
2 Mareen Hufe GER 01:06:52 04:47:38 03:10:18 09:09:16 -13:20 US$ 5000
3 Yvonne Van Vlerken NED 01:02:53 04:49:09 03:15:50 09:12:07 10:56 US$ 3250
4 Dimity-Lee Duke AUS 01:02:33 05:03:29 03:16:05 09:26:38 -04:39 US$ 2500
5 Georgie Rutherford GBR 00:59:31 05:21:09 03:47:22 10:17:47 n/a US$ 1750

Photo Credits: Korupt Vision/Ironman, Witsup

Select your currency
EUR Euro

By continuing to use the site, you agree to the use of cookies. more information

The cookie settings on this website are set to "allow cookies" to give you the best browsing experience possible. If you continue to use this website without changing your cookie settings or you click "Accept" below then you are consenting to this.

Close