Skip to content

IM Hawaii

Kona 2018 – How the Female Race Unfolded

Here are the results of the top finishers of the female Pro race in Kona 2018 (full results can be found here, a detailed look at the men’s Pro race here):

Rank Name Nation Swim Bike Run Time Diff to exp. Prize Money
1 Daniela Ryf SUI 00:57:27 04:26:07 02:57:05 08:26:18 -17:26 US$ 120,000
2 Lucy Charles GBR 00:48:14 04:38:10 03:05:50 08:36:34 -25:35 US$ 60,000
3 Anne Haug GER 00:54:21 04:47:45 02:55:20 08:41:58 -30:22 US$ 40,000
4 Sarah True USA 00:52:06 04:49:19 02:57:38 08:43:43 -19:47 US$ 22,500
5 Mirinda Carfrae AUS 00:58:18 04:46:05 03:01:41 08:50:45 -10:54 US$ 19,000
6 Sarah Crowley AUS 00:54:19 04:43:09 03:10:29 08:52:30 -18:51 US$ 16,000
7 Kaisa Sali FIN 00:58:23 04:44:31 03:06:04 08:54:28 -06:45 US$ 14,000
8 Angela Naeth CAN 00:58:28 04:42:25 03:11:11 08:57:36 -35:49 US$ 12,500
9 Corinne Abraham GBR 00:58:44 04:38:16 03:16:26 08:57:55 -12:46 US$ 11,000
10 Linsey Corbin USA 00:58:24 04:48:29 03:07:15 08:58:58 -13:13 US$ 10,000
11 Sarah Piampiano USA 01:05:04 04:52:01 02:59:26 09:01:57 -15:56
12 Liz Blatchford AUS 00:52:09 04:53:32 03:15:17 09:06:20 -05:09
13 Mareen Hufe GER 00:58:34 04:43:50 03:18:40 09:06:35 -11:50
14 Heather Jackson USA 00:58:18 04:44:45 03:21:56 09:09:16 06:32

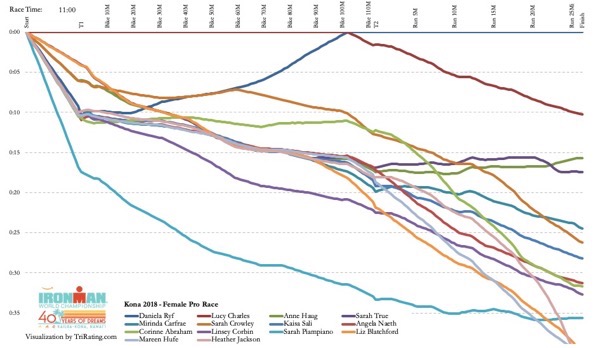
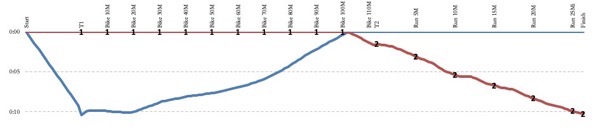
Here’s the Race Development Graph for these athletes:
Kona 2018 Women

Kona Champion: Daniela Ryf

Even jelly fish stings shortly before the race couldn’t stop Daniela from defending her title and also setting new records:
Kona Dani

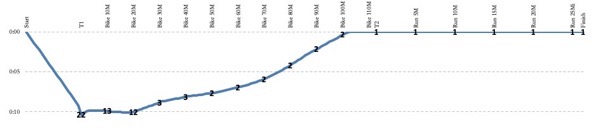
Before the race there was pretty much agreement that Dani would be able to defend her title unless something serious happened to her. This year, something serious did happened to her – she was stung by jellyfish under both armpits and was seriously thinking about not even starting the race. She decided to give it a try and said she felt so slow that she was sure she was in last place. It wasn’t quite that slow (she still swam under an hour and faster than Mirinda Carfrae or Kaisa Sali), but she lost nine minutes to Lucy Charles (twice as much time as last year) and when she took some extra time in T1 she was even further behind, starting the bike in 22nd place in a group with a few other contenders who were probably very surprised to ride with Dani. She gained a few spots in the first hour of the bike, but didn’t make up any ground to Lucy. But once she passed the Airport, she was able to put the pain from the stings aside and slowly started to move ahead and close the gap. By the turn in Hawi, she had moved into second place and was also riding too fast for Sarah Crowley who had been riding with her for a few miles – but she was still seven minutes behind Lucy.

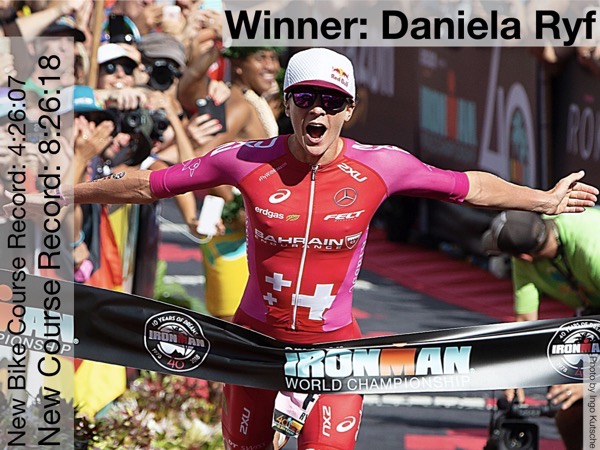
What followed was a demonstration of her domination on the Ironman distance: She closed the gap to Lucy in the next 40 miles and posted one of the fastest second half bike splits overall. (One of the stats making the round after the race was that she rode the last 70k of the bike quicker than male winner Patrick Lange, and there were only seven Pro men riding that section faster than her.) She took the lead from Lucy at about mile 102 (even a bit earlier than last year) and with a bike split of 4:26:07 annihilated the long-standing bike record (4:44:19 by Karin Thürig from 2011). Even though the conditions were fast this year and there were five more athletes breaking the old record, she still posted the fastest bike split by more than twelve minutes!

Still, Dani started the run only 90 seconds ahead of Lucy, so she still needed a solid run after that very hard bike leg to secure her fourth Kona title in a row. She never allowed any doubt about her marathon (or any hope for Lucy): In fact she almost posted a new marathon PR, her 2:57 missed her best run from 2016 by just 14 seconds. In the end, an ecstatic Dani crossed the line with a ten-minute margin to second place, of course with a new course record of 8:26:07 – an improvement on her 2016 time by more than 20 minutes. In all the excitement on race day it went pretty much unnoticed that this is also the fastest time ever in an Ironman-branded race, there are only three quicker finishes in Roth (8:22 by Dani in 2016 and Chrissie Wellington’s 8:18 and 8:19 in 2010 and 2011).
Dani Finish

Second: Lucy Charles

With another great performance, Lucy again claimed second place for the second year in a row:
Kona Lucy

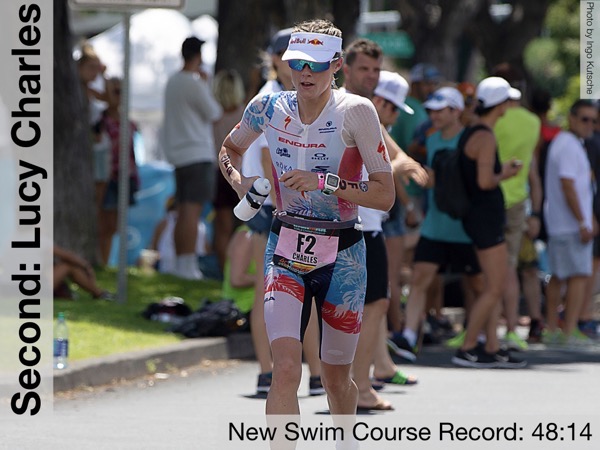
Once again Lucy had a great start of the race and was leading the race into T1. She had said before the race that she wanted to go for the swim course record, and from the gun she was swimming at a hard pace, quickly leaving the rest of the field behind. Her pace was spot on: Her 48:14 broke Jodi Jackson’s 1999 swim course record by 29 seconds. She didn’t know anything of Daniela’s problems during the swim and started to also set a fast pace on the bike. She delivered another great performance in Kona: In addition to breaking the swim course record, she was six minutes faster than the old bike course record, and almost posted a new run PR (she missed her run time from South Africa by five seconds). When she crossed the finish line in 8:36:14, she was ten minutes quicker than the old course record. Nonetheless, Lucy’s 2018 race was pretty much a copy of last year: Leading after the swim and for most of the bike, she was overtaken by Dani shortly before T2, and a good run allowed her to finish second by a good margin to third place: two minutes in 2017, five minutes this year.
Lucy Palani

Third and Fourth: Anne Haug & Sarah True

While the first two places were pretty much decided in T2, the race for third was close until just before the finish line when Anne Haug was able to overtake Sarah True:
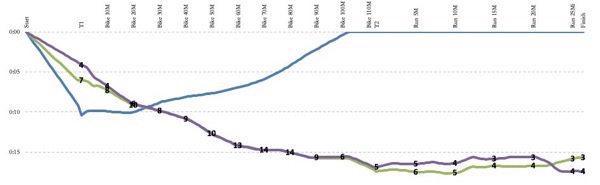
Kona Anne Sarah

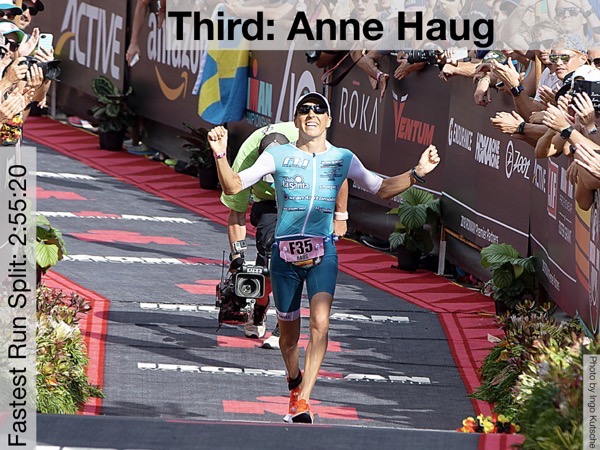
Both didn’t lose too much time in the swim (four minutes for Sarah, six minutes for Anne), and both were happy to settle into a bigger big group that formed behind the leading athletes. The positions shown in the graph above are a bit misleading – the group was close to 15 athletes riding between fifth and 20th place. For most of the bike ride, the two rookies were happy to follow the pace set by more experienced athletes, eventually riding 15 minutes behind the leaders. Around 90 miles into the bike, Sarah was still feeling good and started to ride a strong, focused pace and the group started to fall apart. Anne was able to match her pace and they started the run in fifth and sixth place within 30 seconds of each other. Sarah and Anne were running the fastest pace in the female field and by the time they left the Energy Lab, they had moved into third and fourth place, still less than a minute apart. Anne was especially strong towards the end, moved into third place less than five miles from the finish and ran the best female marathon of the day with a 2:55 – the fastest Kona run since Rinny’s course run record in 2014.
Anne Finish

Sarah admits that she ran the first part of the run with too much excitement: “I paid for my early pace after the halfway point and started to have GI distress and problems with nutrition. Before Anne passed me, I was aware that I might have difficulty finishing if I didn’t slow down through aid stations and start to take in more nutrition. While this approach helped me salvage my race, I definitely suffered quite a bit. I don’t remember the last bit of the race which is a shame. I wanted to experience all of Kona, but being in survival mode meant that I don’t remember crossing the finish line very well. I guess I’ll have to go back to experience it fully!”
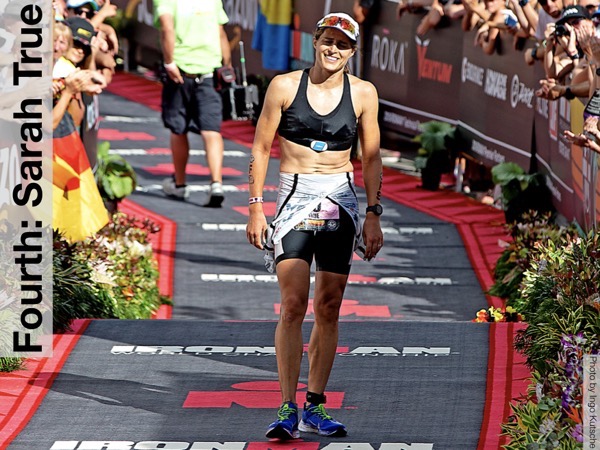
SarahT Finish

Fifth to Ninth: Mirinda Carfrae, Sarah Crowley, Kaisa Sali, Angela Naeth, and Corinne Abraham
Kona 5to9

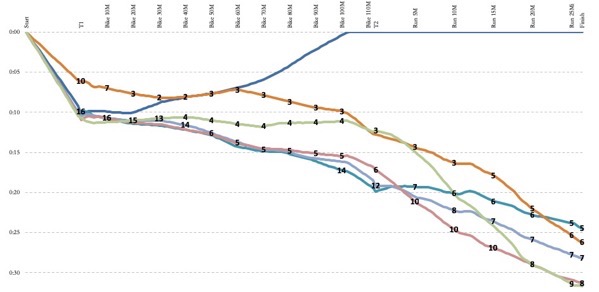
There were two athletes that were able to ride between Lucy and Dani in front and the large bike group about ten to 15 minutes behind the lead. As last year, Sarah Crowley (orange line) was sticking to Daniela, but had to let her go shortly after the turnaround. By T2 she was over twelve minutes back, and she was overtaken by Corinne Abraham (green line) who was able to ride five minutes into the big bike group by posting the third-best bike split (just 6 seconds slower than Lucy Charles). Corinne wasn’t able to do much run training and after the race was happy to finish in ninth place when she rallied to run with Angela Naeth after the Energy Lab. Sarah ran in third place on Ali’i, but then she was overtaken, first by Anne and Sarah and then – shortly after exiting the Energy Lab – by Mirinda Carfrae. Sarah ended up finishing sixth but she was clearly racing for more.

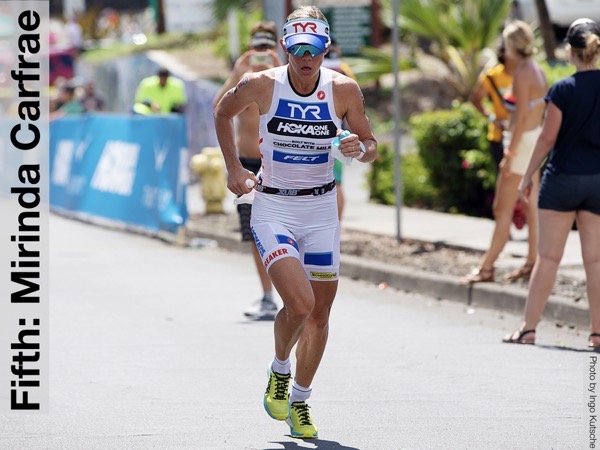
In her comeback season, Mirinda Carfrae (aqua line) had a solid Kona race. She was part of the big bike group that formed after the swim and while she lost almost twenty minutes to Daniela Ryf and started the run in 14th pace, she was just over five minutes behind the podium ranks in T2. Rinny quickly moved into the Top 10, but others from the bike group (Anne Haug, Sarah True) were running a bit quicker than her so this year her run through the field ended in fifth place.
Rinny Palani

The other proven strong runner in the big bike group was Kaisa Sali (blue line). A 3:06 marathon was good enough for a seventh-place finish but not enough to make up ground to the athletes in front of her. Even though Angela Naeth (red line) was five minutes slower than Kaisa on the run, she is probably quite happy with her Kona marathon – the only time she ever ran a better time was in her win at IM Texas in 2015. Angela has been getting faster in each IM marathon she completed in her 2018 season.

Falling Back and Coming From Behind: Linsey Corbin, Sarah Piampiano, Liz Blatchford, Mareen Hufe and Heather Jackson

There are two different story types for the athletes finishing between ninth and 14th place:
Kona 10to14

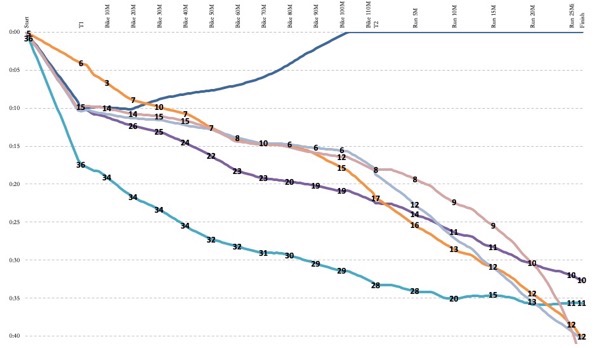
Linsey Corbin (violet line) quickly lost touch with the big bike group, but riding her own pace she didn’t lose too much time: In T2 she was 18th, but only three to five minutes behind a lot of athletes. A steady 3:07 marathon saw her slowly climb the ranks and finish in tenth place, the last Pro to earn prize money.

The fourth sub-3 Kona 2018 marathon was run by Sarah Piampiano (turquoise line) who ended the race in eleventh place. As is typical for her, she lost a lot of time in the swim and started the bike in 36th place (fourth-to-last). By T2 she was able to gain a few spots, but she was still 15 minutes behind tenth place. But she had an almost evenly paced marathon, ending up in eleventh place just three minutes short of the Top 10.

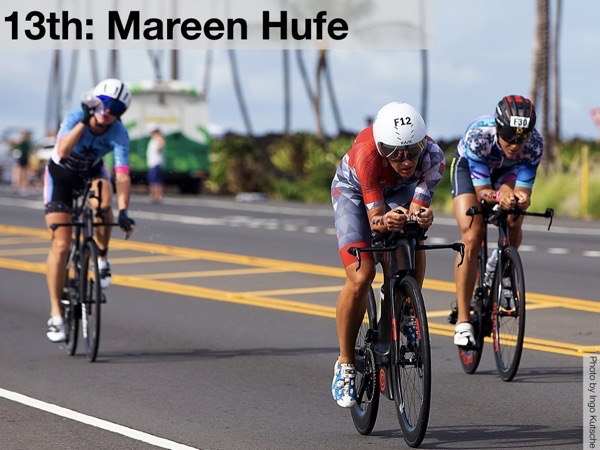
The next three spots were taken by athletes that worked hard on the bike to put themselves in good positions but then didn’t quite have the runs that would have been needed for a Top 10 finish. Liz Blatchford (orange line) lost contact with the bike group in the final miles of the bike but then had a solid 3:15 run to finish twelfth. Mareen Hufe (light blue) was once again one of the strongest athletes on the bike and started the run in the Top 10 but with a lot of strong runners around her. She didn’t concede too many spots, but a 3:18 marathon saw her drop back into 13th place.
Mareen Bike

Heather Jackson (pink line) started the run in eighth place and a lot of her fans thought that with her typical fast run she’d be a strong podium contender. But to her own disappointment, she never found a good rhythm and even struggled in the last ten k, dropping back to 14th place.

Credit: All photos by Ingo Kutsche

Observations about the 2018 Female Race

There are a couple of things that have been unusual about the 2018 race:

  • Fast Times
    Even more than on the men’s side, this year’s Kona was extremely fast. Daniela Ryf set a new course record and also the fastest IM-distance time outside of Roth. There are now 22 sub-9 finishes in Kona – ten of them from this year. Until now, there has never been a year with more than two sub-9 finishes!
  • Dominance of Daniela
    Daniela has now won the last four races in Kona, and all of her wins weren’t even close – the smallest gap was in 2017 when Lucy was nine minutes behind. Even this year’s troubles before the swim didn’t stop Dani. If she continues to stay motivated and (mostly) healthy, there isn’t a real challenger for her in sight.
  • Big Bike Group
    With a big bike group forming after the swim that then gets progressively smaller, the female race is becoming more and more similar to the men’s race. Other than Daniela and Lucy (who were in a separate race for most of the day), no one was rewarded for trying to ride their own pace: Both Sarah Crowley and Corinne Abraham who rode in front of the group fell back on the run, and the best-placed athlete behind the group was Linsey Corbin who finished tenth.
    At the same time, the strong bike riders will probably have to think about how they can build a gap in T2 to put some extra pressure on the runners. “Riding steady” as they seemed to do this year is no longer enough to shake off the athletes not quite as strong on the bike, but a gap will be needed if they want to place well in the deep Kona field.
  • Strong Running required
    The marathon in Kona is getting quicker from year to year, and a sub-3:10 run is now almost required for a Top 10 finish. (In 2018 there was only Corinne who was more than a few seconds above 3:10, while there were four each in 2016 and 2017.) While this is also a consequence of the big bike group, this is unlikely to change in the next years – if anything run times will stay at the same level while the bike times are also getting faster. Quite a challenge for the athletes that want to step up to a Top 10 finish!

Kona Pro Slots – Part 3: Opinion

In this series of blog posts on Kona Pro Slots, I’ve looked at Reverse Engineering The Assignment Algorithm and ideas for Different Approaches – both of these posts have been close to the facts. This post contains my views on the current algorithm, a bit of speculation on what Ironman was looking for and some bigger and smaller changes going forward. The following thoughts are my opinion, and I would love this to be a starting point for a broader discussion of how to get the best, most interesting races in Kona as possible.

On Its Own, the Assignment Algorithm Is Fair

I’ve had a detailed look at potential algorithms for assigning slots in Part 1 of this series. Here’s the graph summarizing the different approaches:

Algorithms4Slots

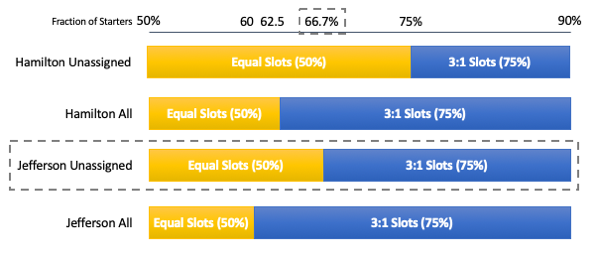
The algorithm that makes it hardest for the larger group (usually the men) to get both slots is “Hamilton Unassigned” – but it’s quite unfair as their share of slots would always be smaller than their share of starters. The next-best algorithm for the smaller group is the “Jefferson Unassigned”, and that’s the algorithm that Ironman has in all likelihood chosen to use (that’s why it’s highlighted).

I also find it reasonable that Ironman slightly tweaks the algorithm for Regional Championships as they have more fixed slots: If they used the unaltered Jefferson Unassigned, again you’d end up with a situation where the larger group’s share of slots is always smaller than their share of slots. The tweak is not very elegant, but the resulting slot assignment looks quite reasonable to me.

But Only If You Accept Proportional Assignment Based on Starters

Even if the slot assignment algorithm is fair, this doesn’t mean I like the overall system as it’s solely based on the number of starters. At first, this sounds reasonable (after all it has been used for assigning age group slots), but there should be other factors in order to determine the athletes that will likely have the biggest impact on the Kona races. (I have highlighted some of these factors such as Strength of Field or Race Performance in Part 2 of this series.)

I want to note that this discussion is a slippery slope as it can quickly deteriorate into an “X doesn’t deserve to be in Kona” type of argument that isn’t fair to anyone involved (or useful). For example, I think that Carrie Lester’s 8:44 in Arizona should have been good enough for a Kona slot – but that would have to come at the cost of TJ Tollakson who has been working hard to overcome his back problems and it’s great to see him qualify once again for Kona. But it’s hard to avoid this “men vs. women” discussion – after all the women will only get more slots if they “take” them from the men which is hardly the best way of developing our sport.

So Why Is Ironman Keeping the Algorithm Secret?

One of the criticisms leveled at Ironman is that they haven’t made much information about their slot assignment algorithm available – and the quick conclusion by some was that “Ironman must be hiding something”, even going so far as suggesting that there isn’t a real algorithm and that the unassigned slots “always go to the men”. As stated above, that is not the actual procedure (see Western Australia for a counter-example), but not being transparent has led to some confusion and frustration.

To be honest, I’m not really sure why Ironman isn’t making more information available. I can only guess that they want to avoid discussion at race sites about the slots (both for the Pros and the agegroupers) and that they want to be able to change some details whenever they see the need for it. But even in the absence of “official details”, I don’t really see “sinister motives” on Ironman’s side in keeping things private.

Has Ironman Just Been Unlucky With Arizona and Mar del Plata?

On one hand, Arizona and Mar del Plata have been very close to ending up with equal slots. (For Arizona, things shifted between the race meeting and race day, for Mar del Plata just one more woman or one less male would have made a difference.) Based on last year’s numbers Ironman probably expected equal slots: Arizona was 25–22 and Mar del Plata was 16-13, with would have clearly been equal slots.

I think that Ironman was hoping for a more equal distribution of Pro slots than in the past – maybe not providing equal slots but at least a lot closer than under the KPR system. And to a certain degree, that is what’s going to happen: Even if all the currently unassigned slots in the 2019 races go to the men, we will have at least the same number of WPROs with Kona slots as in the past.

On the other hand, the small number of starters pretty much assures that there will be some more “weirdness” in assigning the slots, similar to what we’ve seen in Arizona and Mar del Plata. This is a result of the small number of slots and the small number of racers. The “random” decisions of just one or two athletes can influence how the slots will be assigned, while that is extremely unlikely with around 50 agegroup slots and typically 2000 racers or the even larger numbers of seats and votes in context of elections.

Equal Slots Is the Cleanest Solution to This Conundrum

So what should be done moving forward? For a while there has been a push for equal slots for the Pro men and women in Kona, and I continue to believe that this is the cleanest solution on how to assign slots: When giving men and women the same number of slots we won’t have to debate the merits of this or another slot assignment algorithm. ‘Nuff said!

But I Also Have a Few More Realistic Suggestions

As “Equal Slots” would be a pretty big change for Ironman, I’m not holding my breath for this to happen in the next few seasons. (Though as Rachel Joyce has put it, I’m sure that “equality will prevail eventually”.) While I’m also not a fan of drastic changes without giving the current system to play out a bit more, here are a few ideas for minor “tweaks” intended to make the current system work a bit more smoothly:

  • Announce Slot Distribution at the Pro Meeting
    In order to minimize surprises on race day, the slot distribution could be fixed on the number of Pros that sign in at the Pro Meeting. This would also give Ironman a chance to announce the slots at the Pro Meeting.
    The difference between the number of athletes at the Pro Meeting and on race morning is almost always relatively small – and I’m not sure why someone getting sick in the last few days should have an impact on how the slots fall. I also don’t think that this leaves too much room for manipulation – when someone shows up to the Pro Meeting, the extra burden of putting their toes in the water on race morning is pretty small.
  • Fix the Total Number of Male and Female Slots for the Season
    Looking at the total number of Pro starters in the 2018 qualifying season (September 2017 to August 2018), I get 416 female and 772 male Pro starts. Applying those numbers to 20 unassigned slots (ten for the Regionals and another ten for Ironman races with unassigned slots) would lead to 7 female and 13 male Pro slots (pretty much regardless of the actual algorithm). When announcing the races for the upcoming season, Ironman could assign the slots to the races on the calendar, making it clear long before the races how many slots there will be for each gender.

While minimizing the surprises, implementing either of these suggestions would keep the base “proportional” system in place.  I hope that Ironman will at least discuss tweaking the system for 2020, maybe after we’ve had some more experience with the current system in the first half of 2019.

Kona Pro Slots – Part 2: Different Approaches

The current algorithm applied by Ironman to allocate Pro slots between and women (see my previous post “Kona Pro Slots – Part 1: Reverse Engineering The Assignment Algorithm“) is working based on the size of the field. This post describes two different approaches: Strength of the Field and Performance. I’ll discuss the Pros and Cons of these approaches in my next post.

Strength of Field

Measuring Strength of the Field

Measuring the quality of a field isn’t straightforward: I have tried a number of approaches that either didn’t work or were too complicated before settling on a relatively simple “points” system when showing in my seedings how good a field is. (The details can be found in my March 2017 “Strength of Field” post.) The base approach is to look at which starters have been racing Kona in the two previous years. As we’re looking for a system to determine how many athletes in each category to qualify for Kona, this seems to be a reasonable approach for assigning slots.

Basically, the points system determines how many “Kona athletes” are in the current race. Here’s how the system works:

  • 1 point for each athlete that has raced the previous Kona race (so for the current 2019 qualifying season athletes that have raced Kona 2018),
  • 0.5 points for each athlete that hasn’t raced the previous Kona race but the year before (athletes that haven’t raced Kona 2018 but Kona 2017),
  • 1 bonus point for each athlete that has won Kona in the past,
  • 0.5 bonus points for each athlete that has finished on the podium in Kona before

If you apply these numbers to the male and female fields, you get two numbers that you can then use as the base for the Jefferson Method as determined in the previous post. Please note that this system still favors the male athletes (as the male Pro field in Kona has been larger and there are therefore more male Kona Pros that can contribute points).

Example 1: IM Arizona

First, let’s have a look at the female field in Arizona:

  • Kona 2018 athletes: Annett, Jackson, Kessler, Lester, Robertson, Smith (6 points)
  • No Kona 2017 athletes that haven’t also raced in 2018 (no points)
  • No previous Kona winners (no points)
  • Kona podium: Jackson (0.5 bonus points)

This means the female fields “scores” 6.5 points. Next up, the men’s field:

  • Kona 2018 athletes: Dreitz, Plese, Skipper (3 points)
  • Kona 2017: Llanos (0.5 points)
  • No previous Kona winners (no points)
  • Kona podium: Llanos (0.5 bonus points)

The men’s field has a strength of 4 points. Running these number through the Jefferson Method (for unassigned slots), we get the following grid:

Arizona Strength 1 2
Male 4 4 2
Female 6.5 6.5 3.25
Total   2 slots

The result would have been an even split of slots.

Example 2: IM Mar del Plata

Here’s the strength of the female Pro field in Mar del Plata:

  • Kona 2018 athletes: Carfrae, Cheetham, Crowley, Lundstroem, Piampiano (5 points)
  • No Kona 2017 athletes that haven’t also raced in 2018 (no points)
  • Previous Kona winner: Carfrae (1 bonus point)
  • Kona podium: Carfrae, Crowley (1 bonus point)

This means the female fields “scores” 7 points. The men’s field:

  • Kona 2018 athletes: Chrabot, Hanson, O’Donnell, Potts, Weiss (5 points)
  • No additional Kona 2017 athletes (no points)
  • No previous Kona winners (no points)
  • Kona podium: O’Donnell (0.5 bonus points)

The men’s field has a strength of 5.5 points. Here’s the resulting grid for these numbers, taking into account the extra slots:

Mar del Plata Strength 1 2 3
Male 5.5 Auto 2.75 1.5
Female 7 Auto 3.5 2.33
Total   4 slots (1 each minimum)

Once again, we’d get even slots.

Performance

On the “If We Were Riding” podcast, Kelly O’Mara suggested to not “fix” the number of slot assignment before the race but to use the performance on race day. While her full blown version of “qualifying standards” is much more complicated and probably not workable given the differences between courses and conditions on race day, here is a suggestion on how to compare the performances between the male and female Pros in a given race.

Comparing Finishing Times

When looking at the best finishing times between the men and women, a conversion factor can be calculated. As a start, the average Top 10 finishing time of the male Pros in Kona this year was 8:04:02, the average Top 10 time for the females was 8:48:05. Dividing the female average by the male average, we get a factor of 91.66% that can be used to convert the female times into male equivalents and thus compare their performance. (Obviously, this factor will need to take more races into account if this approach is going to be used, but it seems to reasonable to calculate a factor after each Kona race and then use it for the remainder of the qualifying season.)

Example 1: IM Arizona

When applying the conversion factor to the female times, we get the following order of performances:

  1. 7:55:59 Heather Jackson (8:39:18 * 91.66%)
  2. 8:00:29 Carrie Lester
  3. 8:04:24 Eneko Llanos (no change to his finish time)
  4. 8:07:09 Jen Annett
  5. 8:08:41 Clemente Alonso

As we have four slots available, three would go to the women (Heather, Carrie and Jen) and only one to the men. (This would also “observe” the minimum of one slot for each gender.)

Example 2: IM Western Australia

For Western Australia we get the following performance order:

  1. 7:56:00 Terenzo Bozzone
  2. 7:57:40 Cameron Wurf
  3. 8:05:34 Caroline Steffen
  4. 8:07:18 Matt Burton
  5. 8:09:43 Luke McKenzie

IM WA also has four slots, in this case they would be assigned to three men and one woman.

Example 3: IM Mar del Plata

The conversion for Mar del Plata gives the following ranking:

  1. 7:30:23 Michael Weiss (already qualified)
  2. 7:38:33 Sarah Crowley
  3. 7:39:47 Matt Hanson
  4. 7:41:39 Susie Cheetham
  5. 7:42:22 Mario de Elias
  6. 7:46:30 Minna Koistinen
  7. 7:46:39 Jesper Svensson (already qualified)
  8. 7:48:09 Lukas Kraemer

With six available slots, we’d have an even split with three male and three female slots. (In addition, Mirinda Carfrae validates her Kona Winner slot.)

Kona Pro Slots – Part 1: Reverse Engineering The Assignment Algorithm

Late in 2017 Ironman announced a new system for Kona 2019 Pro Qualifying, moving to a slot-based system almost equal to the agegroup qualifying system. One aspect of the system is “unassigned slots” for some races that will be “assigned according to the ratio of starting Pro Athletes” (as stated in the official “Ironman World Championship Profession Athlete Qualification“). The specific details of the assignment algorithm is considered private by Ironman. Based on the first races and the resulting slot assignments Russell Cox (who is focused on the agegroup side, his data can be found at http://coachcox.co.uk) and I have done our best to reverse engineer this algorithm. This post looks at the available data, potential algorithms and the conclusions that can be drawn. This “algorithm post” will be followed in the next days by one looking at alternative approaches and an “opinion post”.

Data on Races With Unassigned Pro Slots

Here’s a quick look at the Pro races with unassigned slots so far:

  • IM Arizona – 2 MPRO slots (based on 15 female and 32 male Pros starting the race) plus 1m+1f base slot
  • IM Western Australia – 1 Pro slot each (based on 10 female and 13 male Pro starters)  plus 1m+1f base slot
  • IM Mar del Plata (South American Regional Championship) – 2 MPRO slots (based on 15 female and 23 male Pro starters) plus 2m+2f base slots

In addition, Ironman has stated that they use the same algorithm for determining the slot assignment for the agegroups, so we can also cross-reference if the “suspected” algorithm also fits the agegroup slots.

Assignment Algorithms

There are a number of algorithms dealing with a similar problem to slot assignment. Typically, they come from a voting context, where a small number of indivisible “seats” (usually tens to hundreds) has to be assigned based on “votes” (usually thousands). Even though the US voting system is typically majority-based, it also has to deal with a number of “representational” issues. One example is assigning a fair number of seats in the House of Representatives (capped at 435 seats) to the States in relation to their population (total US population based on the 2010 census 308.7 million, with state populations between 37.25 Million and 0.56 Million).

This post looks in detail at the two most widely used approaches, the Hamilton and Jefferson methods using the size of the field as the basis for the slot assignment. Different approaches such as depth of field will be discussed in a follow-up post. When working off the size of the field, it seems best to apply the algorithm to the number of athletes starting the race. The number of registered athletes is often quite different from the number of athletes actually racing, especially on the Pro side. And the number of finishers isn’t finalized for some time during and after the race (especially considering DQs that might be contested for days or weeks), and DNFs often contain an element of bad mechanical luck.

Hamilton Method

The Hamilton Method, also know as Hare-Niemeyer or “Largest Remainder”, is one of the oldest systems of assigning seats. It calculates the number of votes required for a seat by dividing the total number of votes by the number of seats available and then divides the votes a party has received by this number. Another way to put this is that it multiplies the number of available seats with the fraction of votes a party has received. This calculation results in a number with an integer part and a fractional part. According to Wikipedia:

Each party is first allocated a number of seats equal to their integer. This will generally leave some seats unallocated: the parties are then ranked on the basis of the fractional remainders, and the parties with the largest remainders are each allocated one additional seat until all the seats have been allocated.

In the context of Kona slots, the Hamilton Method multiplies the number of slots with the number of starters in a group divided by the total number of starters. The algorithm is probably easier to understand with a few examples.

Hamilton Method on Unassigned Slots

The first suggested algorithm applies the Hamilton method to the number of unassigned slots. (Russ and I believe that this is the “old” method of assigning agegroup slots that was used until the summer of 2018.)

For the Pros, there are two unassigned slots. Using IM Arizona as an example, we get the following calculations:

Arizona Starters Quota
Men 32 1.36 (2* 32/47)
Women 15 0.64 (2* 15/47)
Total 47 2 slots

This means that the men get one slot (the integer part of their ratio), while the second slot would go to the females (as their fractional part of 0.64 is larger than 0.36). As both unassigned slots at IM Arizona went to the men, this is obviously not the algorithm that is used for the 2019 qualifying season.

If you look at this type of calculation, then the larger agegroup will have to be at least three times as large as the smaller one to get both slots (i.e. 75% of the whole Pro field):

HamiltonUnassigned

Obviously this is a very tough requirement, and therefore not very useful to achieve “proportional slots” for the Pros when assigning only two slots. It’s also not fair that the men will always have a smaller fraction of slots than their fraction of the Pro field. It’s a bit of speculation, but I think that Ironman also felt that the system they have been using so far for assigning agegroup slots doesn’t work well for the small number of Pro slots, and that’s why they decided to change their algorithm going into the Kona 2019 qualifying season.

Hamilton Method on All Slots

Another approach would be to apply the Hamilton method on all slots while observing “minimum” slots. Again using Arizona as an example:

Arizona Starters Quota
Men 32 2.72 (4* 32/47)
Women 15 1.28 (4* 15/47)
Total 47 4 slots

This would result in the men getting three slots: two from the integer part of their ratio, and another one because 0.72 is larger than 0.28) – the minimums are already observed in this example. In order for the larger agegroup to get three slots, they would need more than 5/3 of the smaller agegroup or at least 62.5% of the field:

HamiltonAll

While this method gives the observed slot assignment in Arizona, IM has stated that their assignment process is based on the number of unassigned slots and not all slots. It’s also tricky to extend this algorithm to include minimum slots for the bigger number of agegoups for all cases. (For the technically minded: The minimum slots plus the integer parts may already assign more slots than available.) It’s very unlikely that this is the method used by Ironman.

Jefferson Method

The Jefferson Method (also known as D’Hondt method) uses a larger number of operations to determine the slots:

The total votes cast for each party is divided, first by 1, then by 2, then 3, up to s, the total number of seats. The winning entries are the s highest numbers in the whole grid; each party is given as many seats as there are winning entries in its row.

Similar to the Hamilton Method, it can be applied to all slots or only those that are unassigned.

Jefferson Method on Unassigned Slots

Based on the unassigned slots, here’s the resulting Jefferson grid for IM Arizona:

Arizona Starters 1 2
Male 32 32 16
Female 15 15 7.5
Total 47 2 slots

There are two unassigned slots, and as the male starters divided by 2 is larger than the number of females starters, both “winning entries” are from the men and both slots would get assigned to the MPROs. This fits the slot assignment in Arizona.

In general, to get both unassigned slots the larger agegroup needs to have at least twice as many starters as the smaller one, i.e. at least two thirds or 66.7% of the whole Pro field:

JeffersonUnassigned

Jefferson Method on All Slots

As for the Hamilton Method, we can also apply Jefferson Method for all available slots while observing minimums.

Arizona Starters 1 2 3
Male 32 Auto 16 10.34
Female 15 Auto 7.5 5
Total 47 4 slots

Observing minimums is relatively straightforward in the Jefferson Method – instead of starting with the divisor 1, you start with the first divisor that is larger than the minimum. As there is one minimum slot for each, the Divisors start with 2, and again the two unassigned slots would go to the men. For Arizona, this approach would also yield the “observed” 3:1 slots, but as we know that two more WPRO starters would have changed the slots, this can’t be the actual algorithm.

In order to get both slots using this approach, the larger agegroup needs to have at least 60% of the starters:

JeffersonAll

Conclusion .. For Now

Here’s an overview of the different approaches so far:

Algorithms4Slots

Based on the text in the Pro Qualifying Rules (referencing “the ratio of starters to Unassigned Slots”) and the fact that the correct Arizona distribution is yielded by the Jefferson Method on Unassigned slots, I thought that I had identified the method used – that’s why it’s highlighted in the graph shown above. Russ provided further evidence from the age-group side that was supposedly using the same algorithm. (More on the agegroup side of things in Russell’s post on Age Group Kona Slot Allocation.) It also correctly predicts an even split of Pro slots for IM Western Australia. But we have not reached the end of the story yet …

Slot Assignment For Regional Championships

Regional Championships have a different number of slots: While they also have two unassigned slots, they offer two base slots each for the men and women. (IM Arizona has one slot each, plus two unassigned slots.) But as the Pro Qualifying Rules state that the slots are assigned based on “the ratio of starters to Unassigned Slots”), I was confident that there would be even slots in Mar del Plata. Here’s Jefferson Grid for Mar del Plata:

Mar del Plata Starters 1 2
Male 23 23 11.5
Female 15 15 7.5
Total 38 2 slots

However, the actual slot assignment was that both slots went to the men, resulting in the final numbers of four slots for the men and two for the women. So we need another twist to the algorithm.

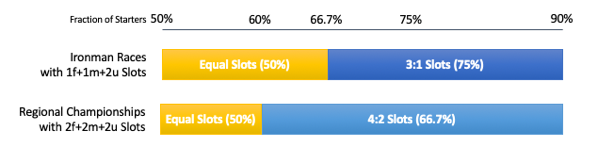
It seems reasonable that the distribution for the unassigned slots is slightly different when there are two base slots as the resulting “uneven distribution” is 3:1 (or 75%) in case of the normal races and 4:2 (or 66.7%) for the Regional Championships. If the Jefferson Method on Unassigned Slots were used, then the fraction of slots for the larger agegroup would always be lower their fraction of starters.

Jefferson Method On All Minus 2 Slots

As the Jefferson Method has been working remarkably well for the Ironman races with just one base slot each, I was looking for slight tweaks to get the right results for Mar del Plata and some of the variations. (Apparently, one more WPRO or one less MPRO would have changed things for Mar del Plata.) This “tweaking” results in the “Jefferson All Minus 2” method:

Mar del Plata Starters 1 2 3
Male 23 Auto 11.5 7.67
Female 15 Auto 7.5 5
Total 38 4 slots (1 each minimum)

This method is equivalent to the Jefferson Method on Unassigned Slots except for the Regional Championships that offer two base slots each. (In addition, it’s the same for agegroups as there is always a minimum of one slot there.)

For the Regional Championships, there is a minimum of 60% of the field needed in order to get both unassigned slots:

JeffersonMinus

Conclusion

Going forward, the “Jefferson Method on All Minus 2 Slots” will be the algorithm I’ll be using to predict how the slot assignments will look like. New results will either send me back to the drawing board, but hopefully they will strengthen the evidence that this is indeed the algorithm Ironman currently uses.

Based on this algorithm, the “inflection points” for the slot assignments are 66.7% of the Pro starters for “regular” Ironman races with unassigned slots and 60% for the Regional Championships:

CurrentSlotAssignment

Select your currency
EUR Euro
USD United States (US) dollar

By continuing to use the site, you agree to the use of cookies. more information

The cookie settings on this website are set to "allow cookies" to give you the best browsing experience possible. If you continue to use this website without changing your cookie settings or you click "Accept" below then you are consenting to this.

Close